« Back to All Charts Detail view

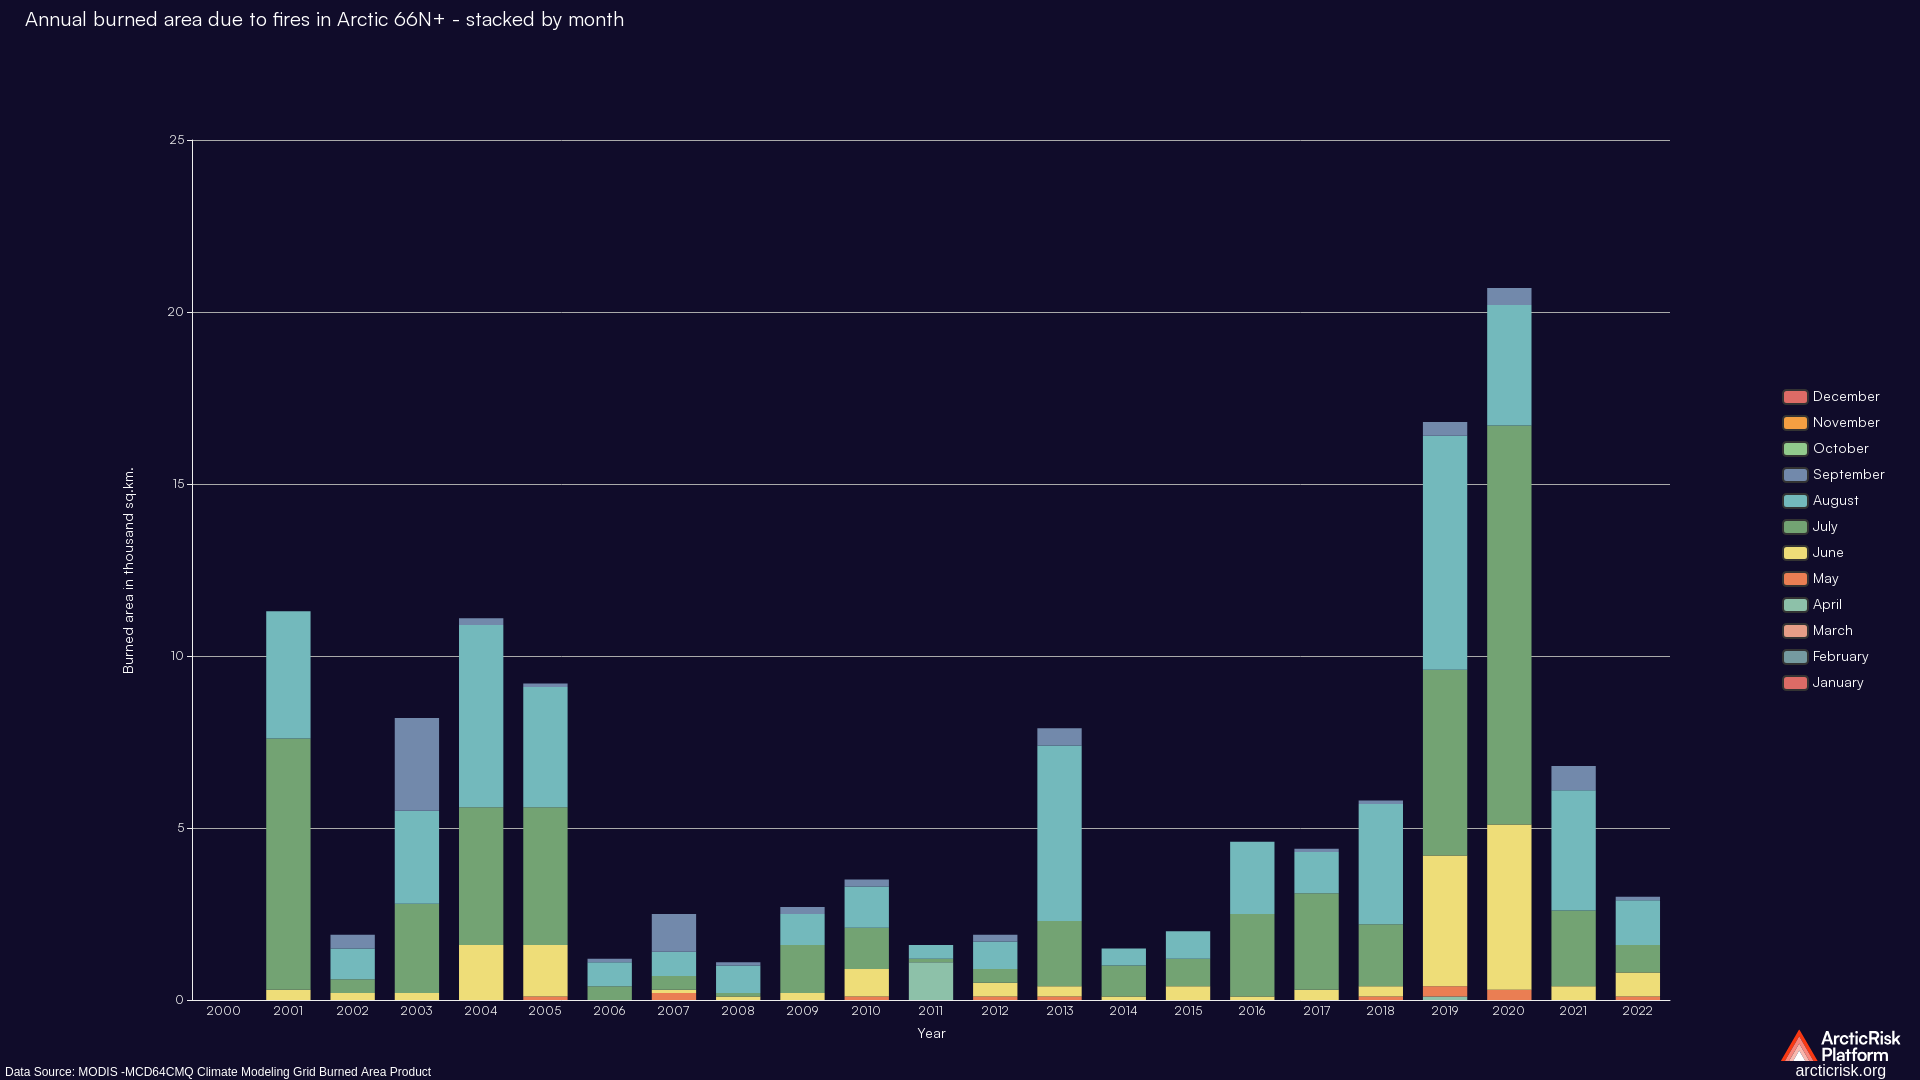
Annual burned area due to fires in Arctic 66N+ - stacked by month

Category: Fires | Last modified: Feb. 11, 2025, 1:35 p.m.

Description:


Monthly total burned area due to fires by latitudnal zones in square kilometres over the years. Data is based on NASA MODIS MCD64CMQ Climate Modeling Grid Burned Area Product. Data provided by Univ of Maryland fuoco.geog.umd.edu
Files:


Echart JSON: Download file

Size: 4.3 KB


JSON_LD: Download file

CSV file: Download file
Chart Image: Open image

Chart image dark
Chart Image: Open image

Chart image

Embed code:


Open embed chart
<iframe src=" http://api.develop.arcticrisk.org/embed_chart/fires~burnedarea~nasa_modis_gridded~fires_burnedarea_nasa_modis_gridded_arctic_monthly_stack_allyears/" width="600" height="465" frameborder="0" allow="accelerometer; clipboard-write; encrypted-media; gyroscope; picture-in-picture"></iframe>
Open embed chart

<iframe src="http://api.develop.arcticrisk.org/embed_chart/fires~burnedarea~nasa_modis_gridded~fires_burnedarea_nasa_modis_gridded_arctic_monthly_stack_allyears/light/" width="600" height="465" frameborder="0" allow="accelerometer; clipboard-write; encrypted-media; gyroscope; picture-in-picture"></iframe>