FREEZE: Climate Data Explorer


Tellus Level-4 Antarctica Mass Anomaly Time Series from JPL GRACE/GRACE-FO Mascon CRI Filtered Release 06.1 version 03

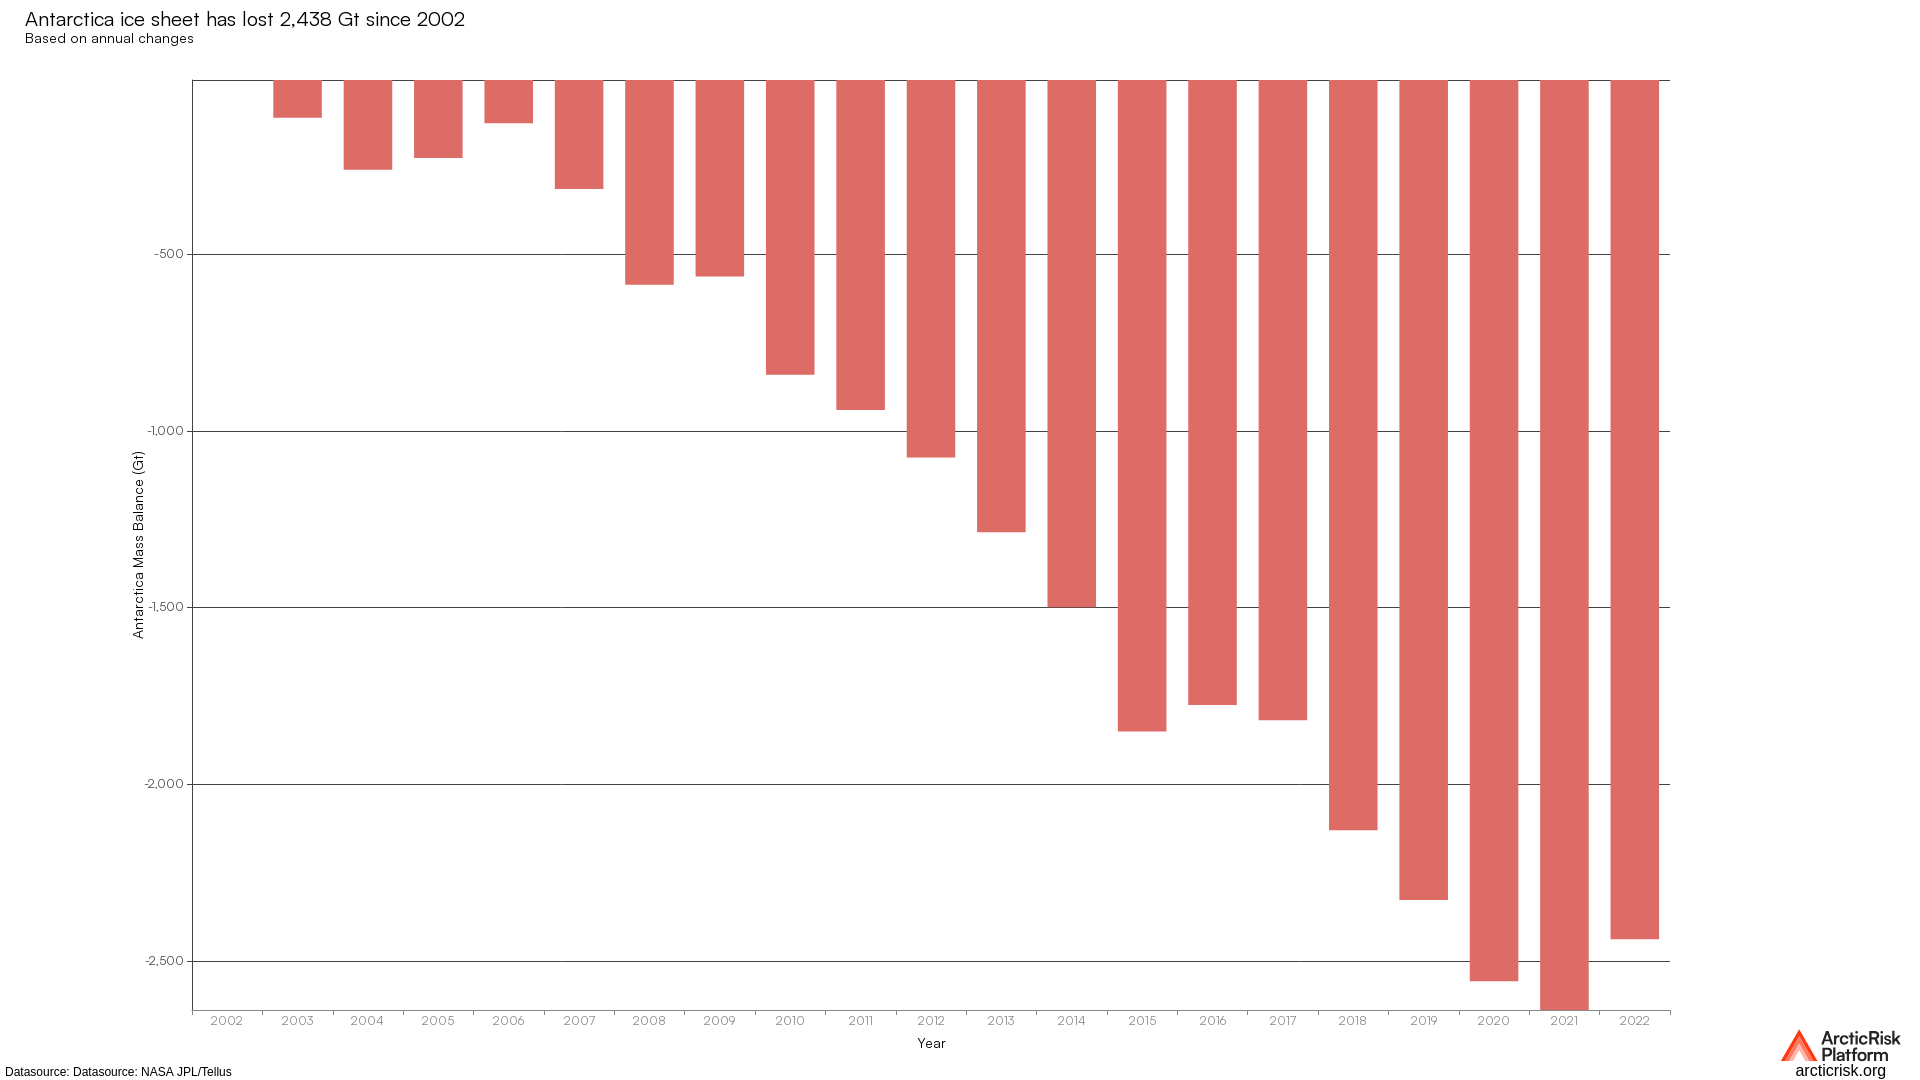
Tellus Level-4 Antarctica Mass Anomaly Time Series from JPL GRACE/GRACE-FO Mascon CRI Filtered Release 06.1 version 03


Tellus Level-4 Antarctica Mass Anomaly Time Series from JPL GRACE/GRACE-FO Mascon CRI Filtered Release 06.1 version 03


Tellus Level-4 Antarctica Mass Anomaly Time Series from JPL GRACE/GRACE-FO Mascon CRI Filtered Release 06.1 version 03
The Germanwatch Global Climate Risk Index is an analysis based on one of the most reliable data sets avaiable on the impacts of extreme…
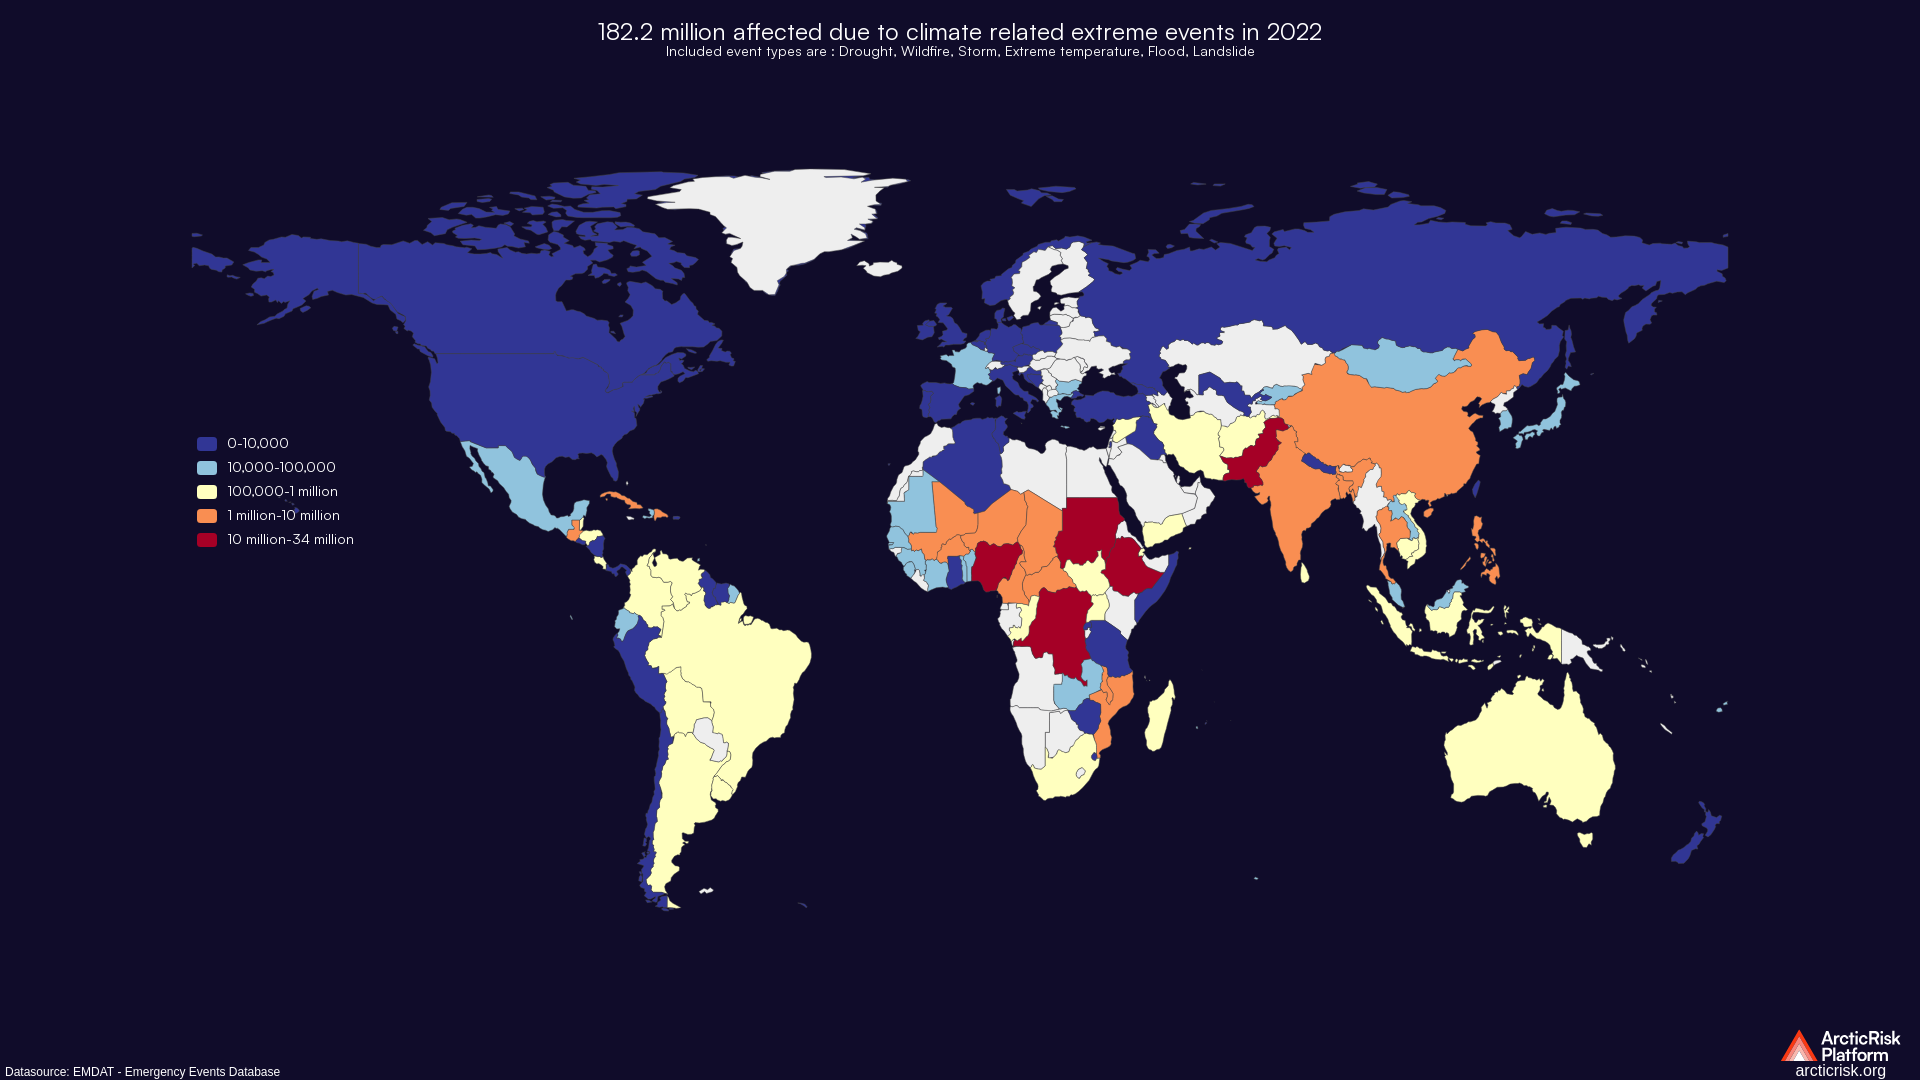
Shows economic damages in billion USD for the year of incident and social impact in terms of number of deaths and number of people affected…


Shows economic damages in billion USD for the year of incident and social impact in terms of number of deaths and number of people affected…


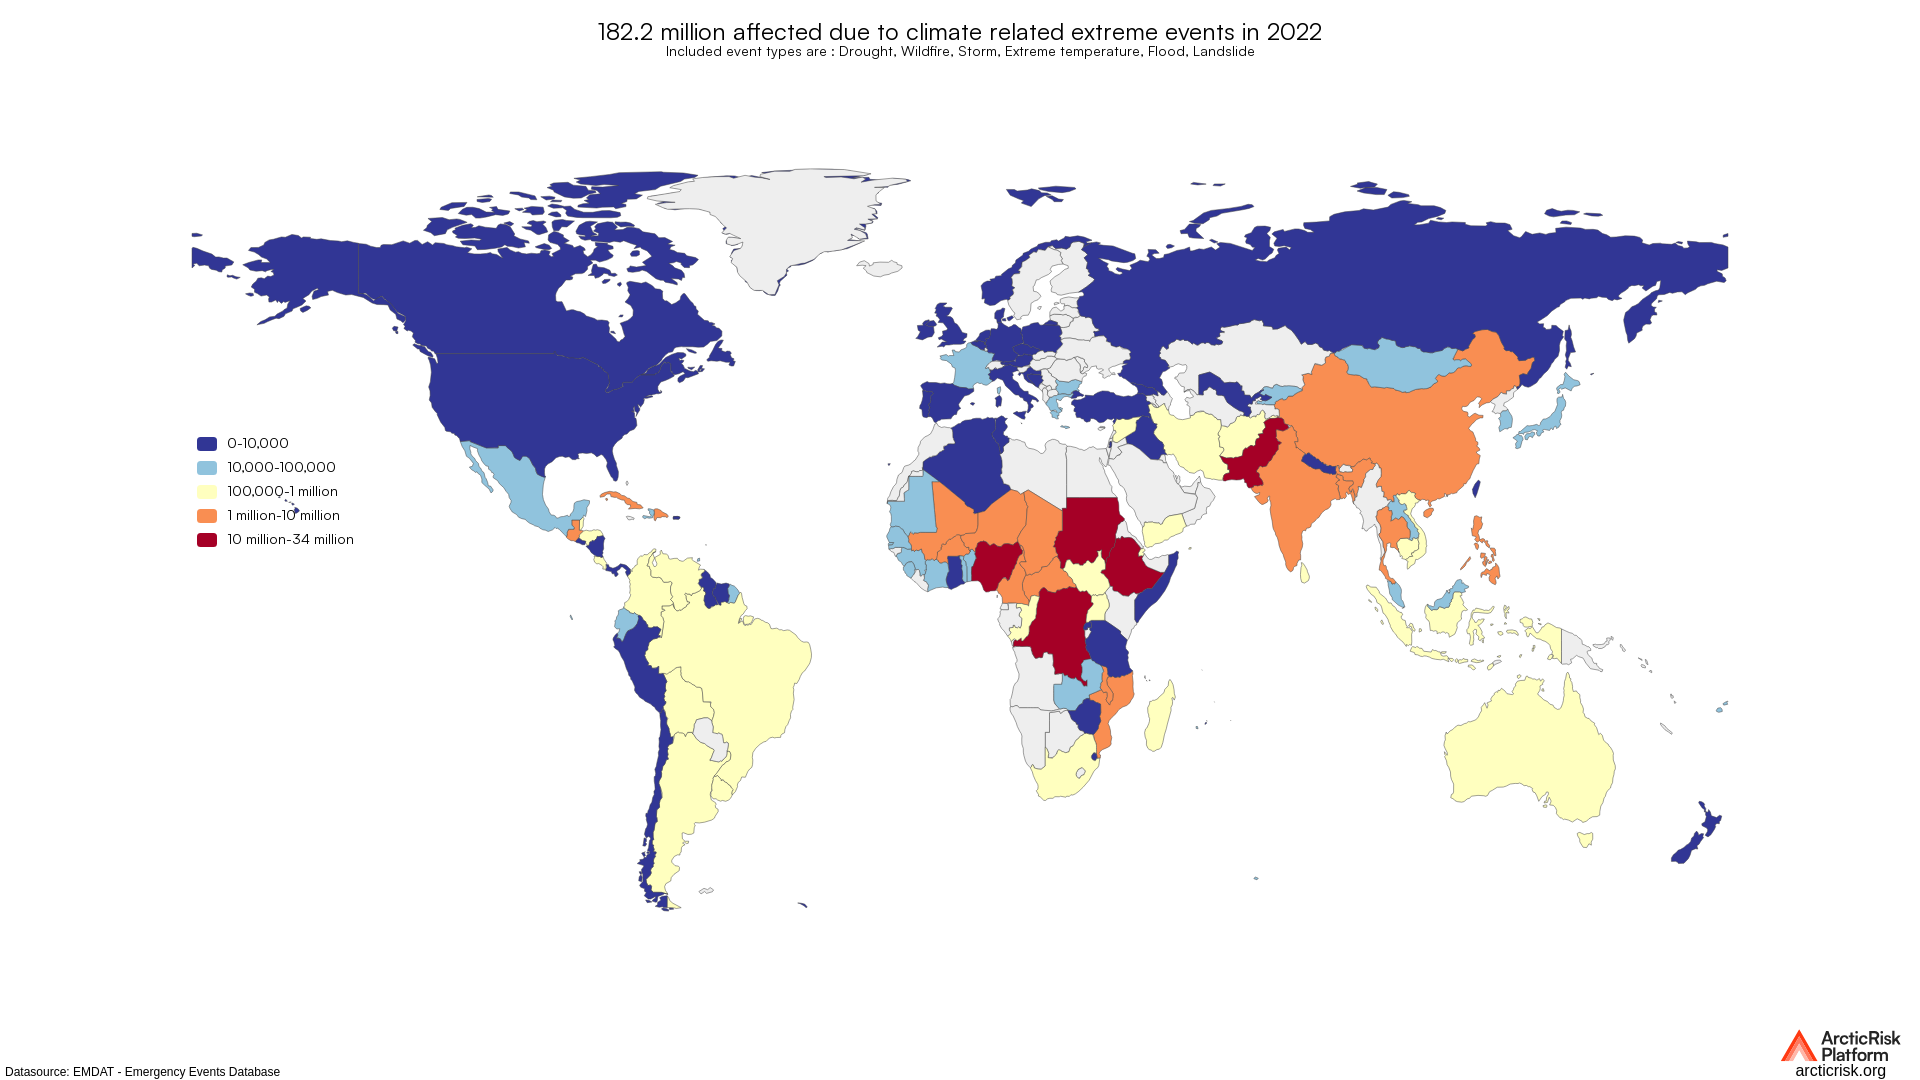
Shows economic damages in billion USD for the year of incident and social impact in terms of number of deaths and number of people affected…


Shows economic damages in billion USD for the year of incident and social impact in terms of number of deaths and number of people affected…


Shows economic damages in billion USD for the year of incident and social impact in terms of number of deaths and number of people affected…


Shows economic damages in billion USD for the year of incident and social impact in terms of number of deaths and number of people affected…

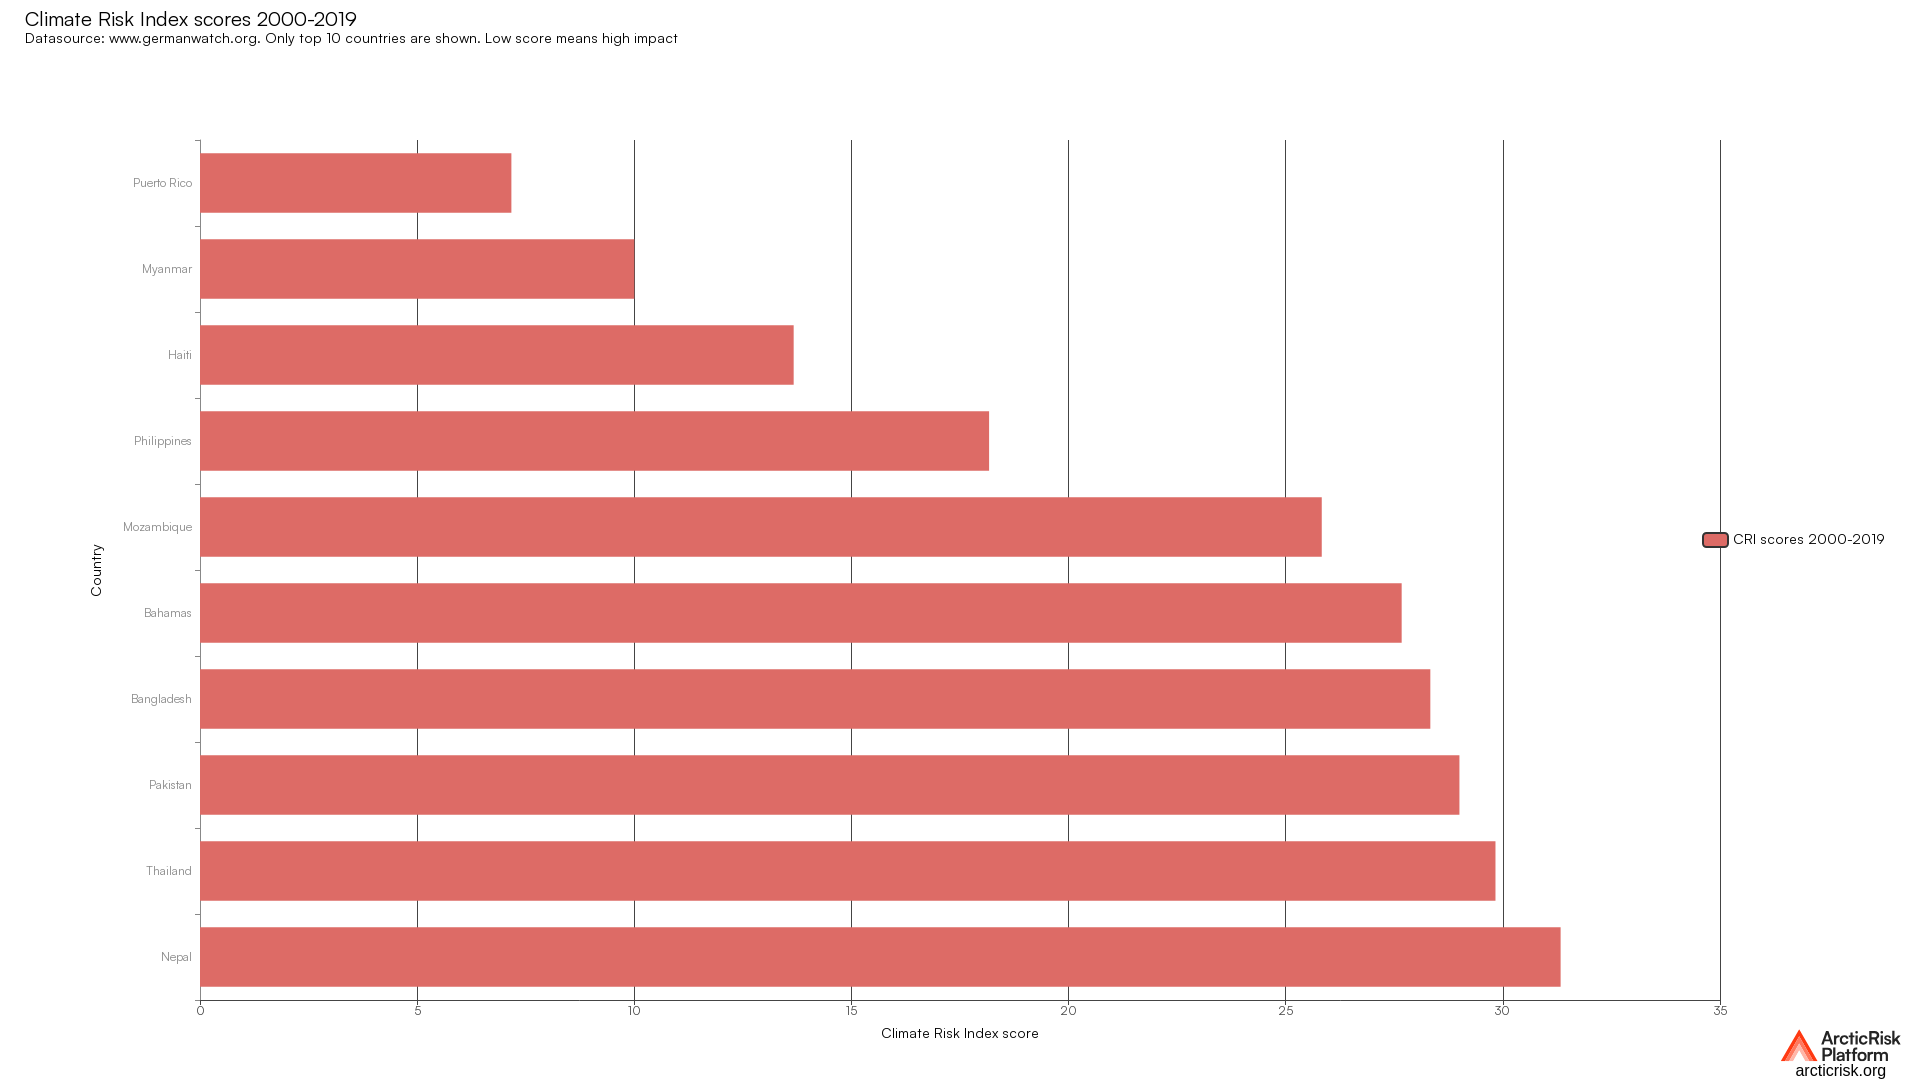
The Germanwatch Global Climate Risk Index is an analysis based on one of the most reliable data sets avaiable on the impacts of extreme…