FREEZE: Climate Data Explorer
The Germanwatch Global Climate Risk Index is an analysis based on one of the most reliable data sets avaiable on the impacts of extreme…
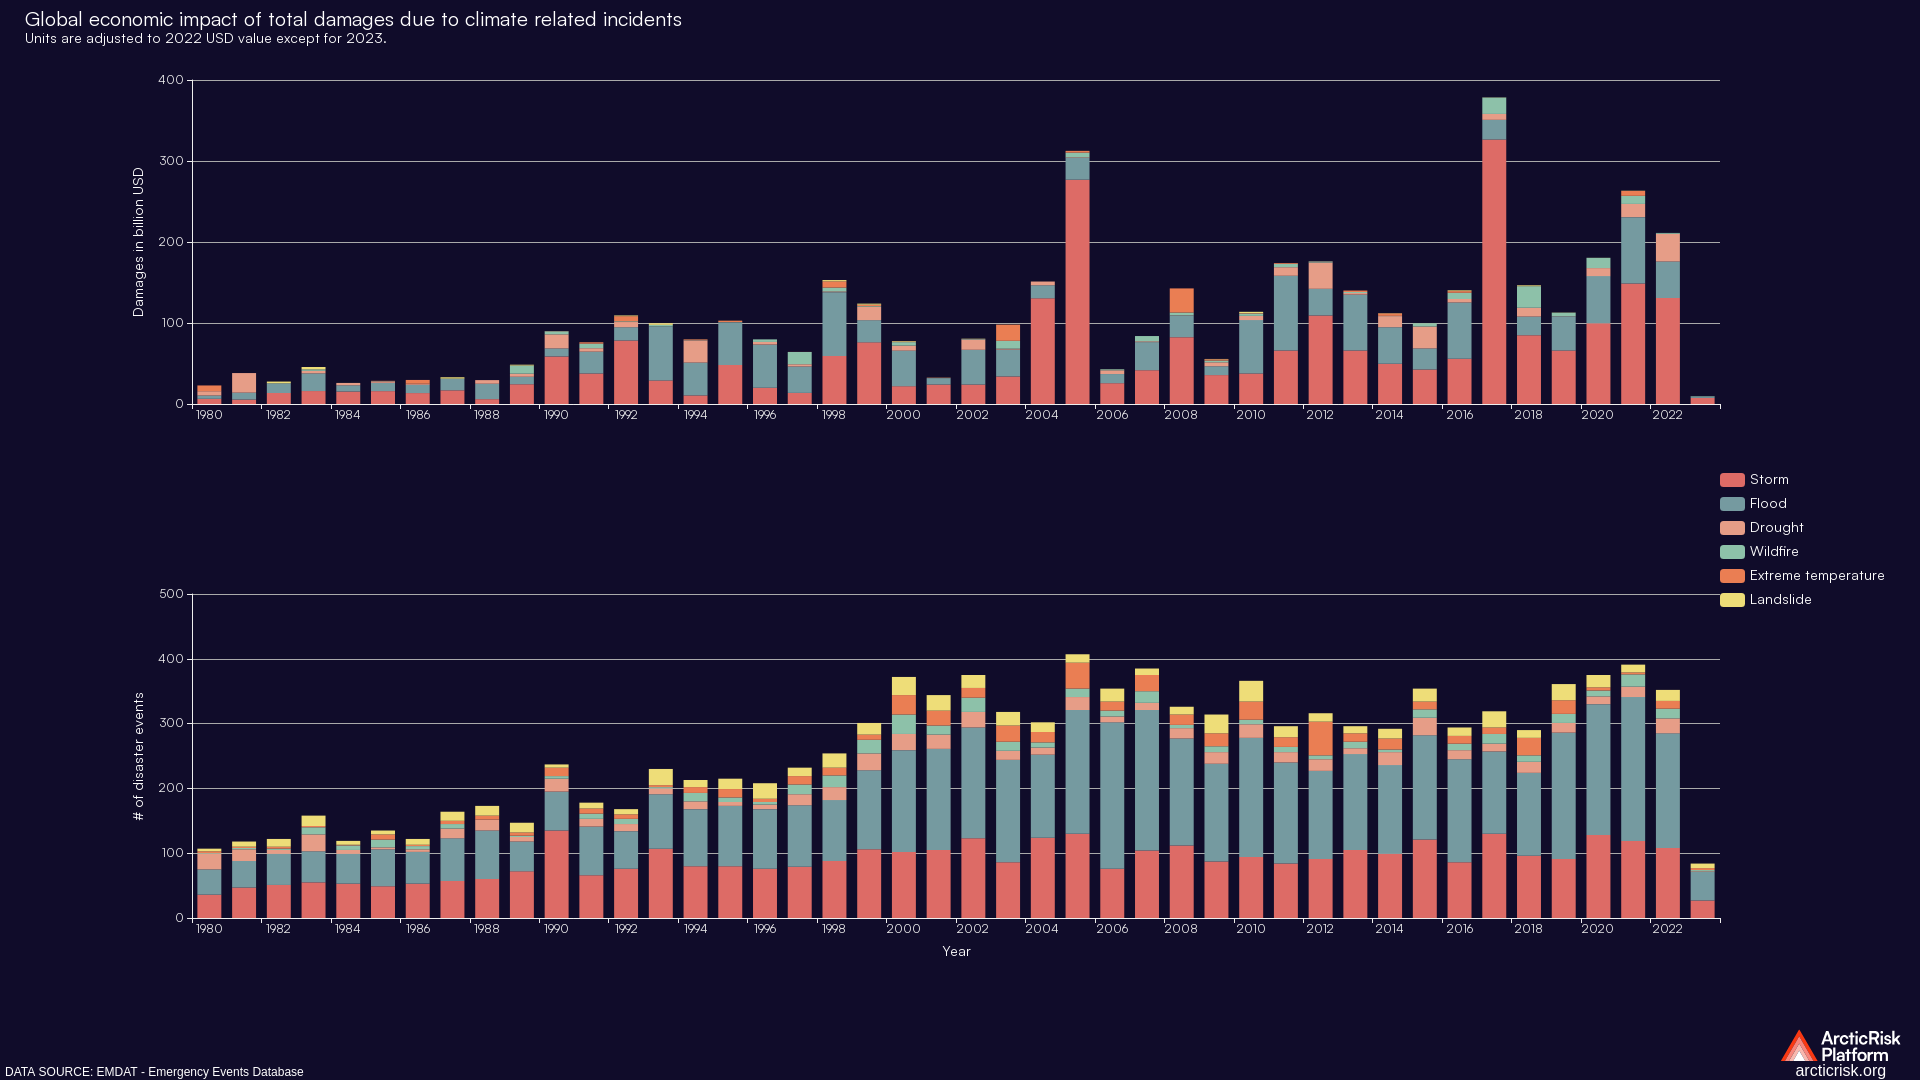

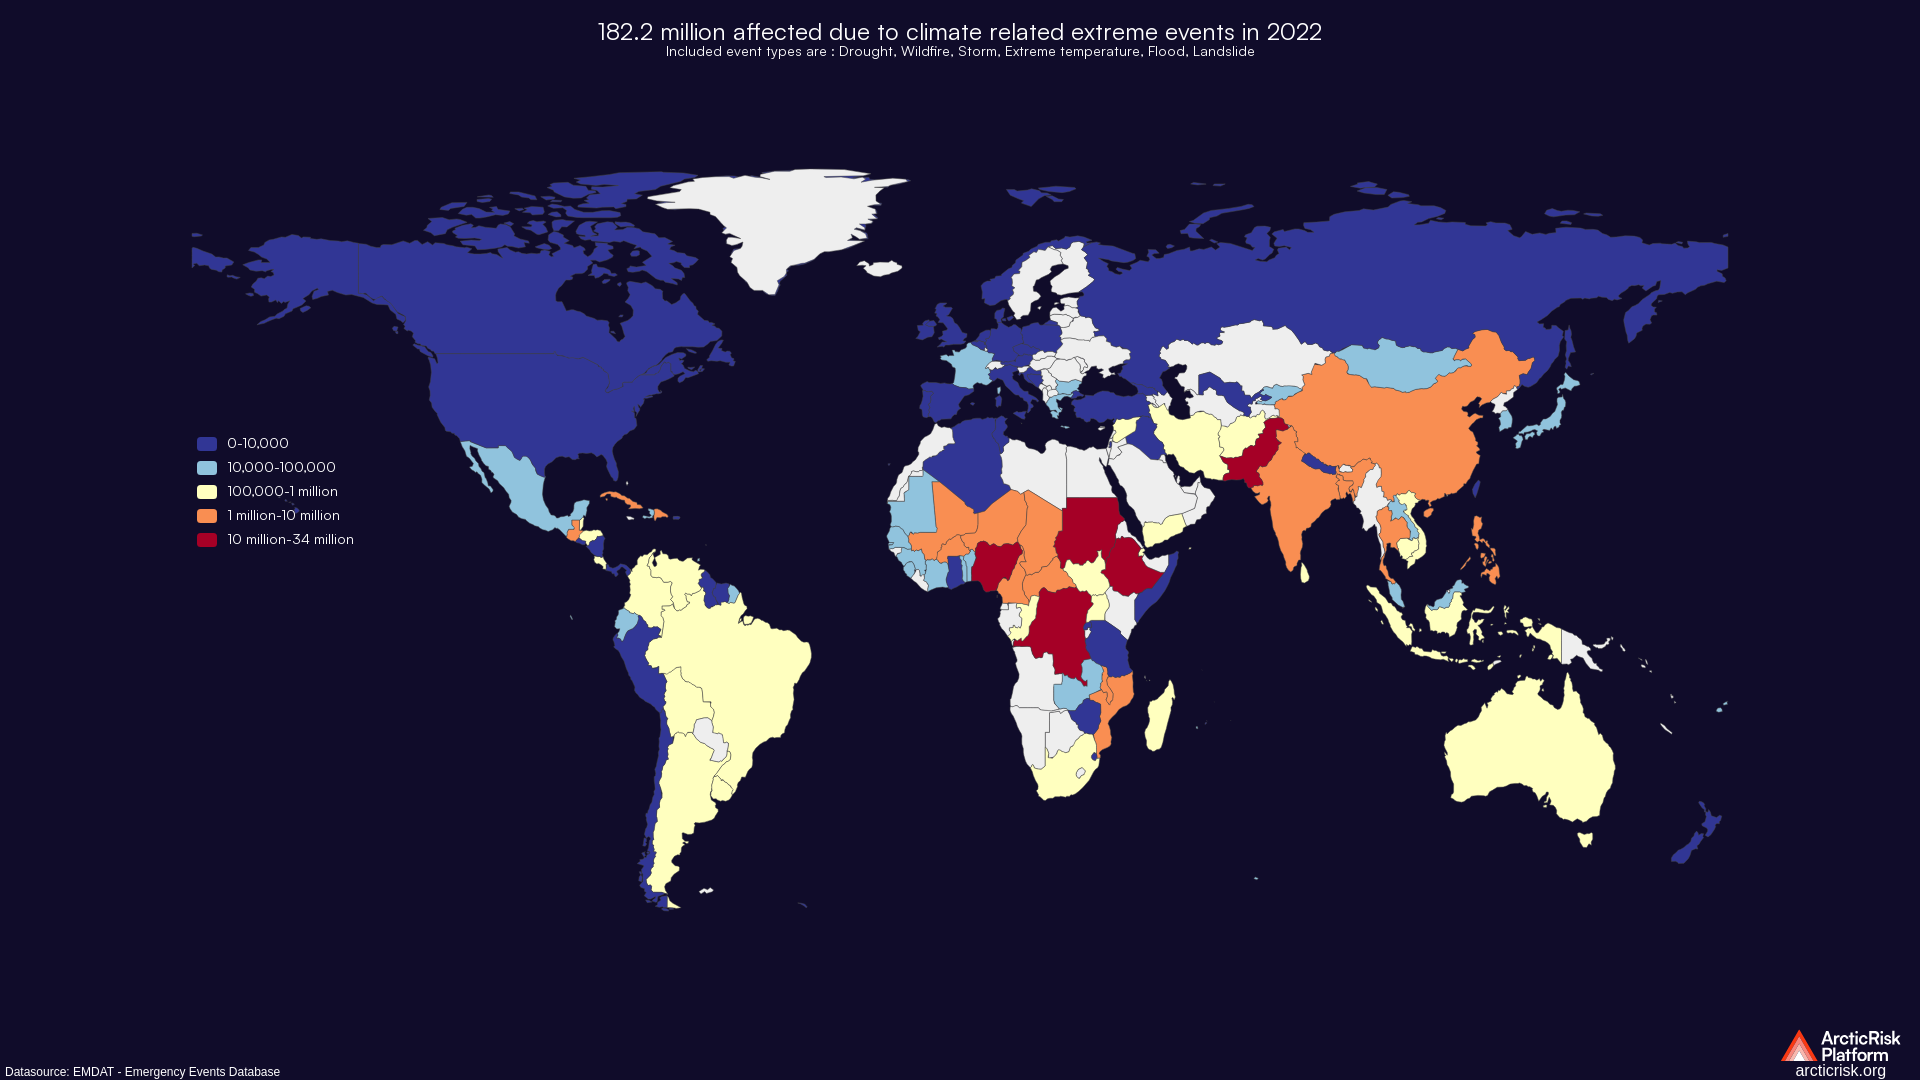
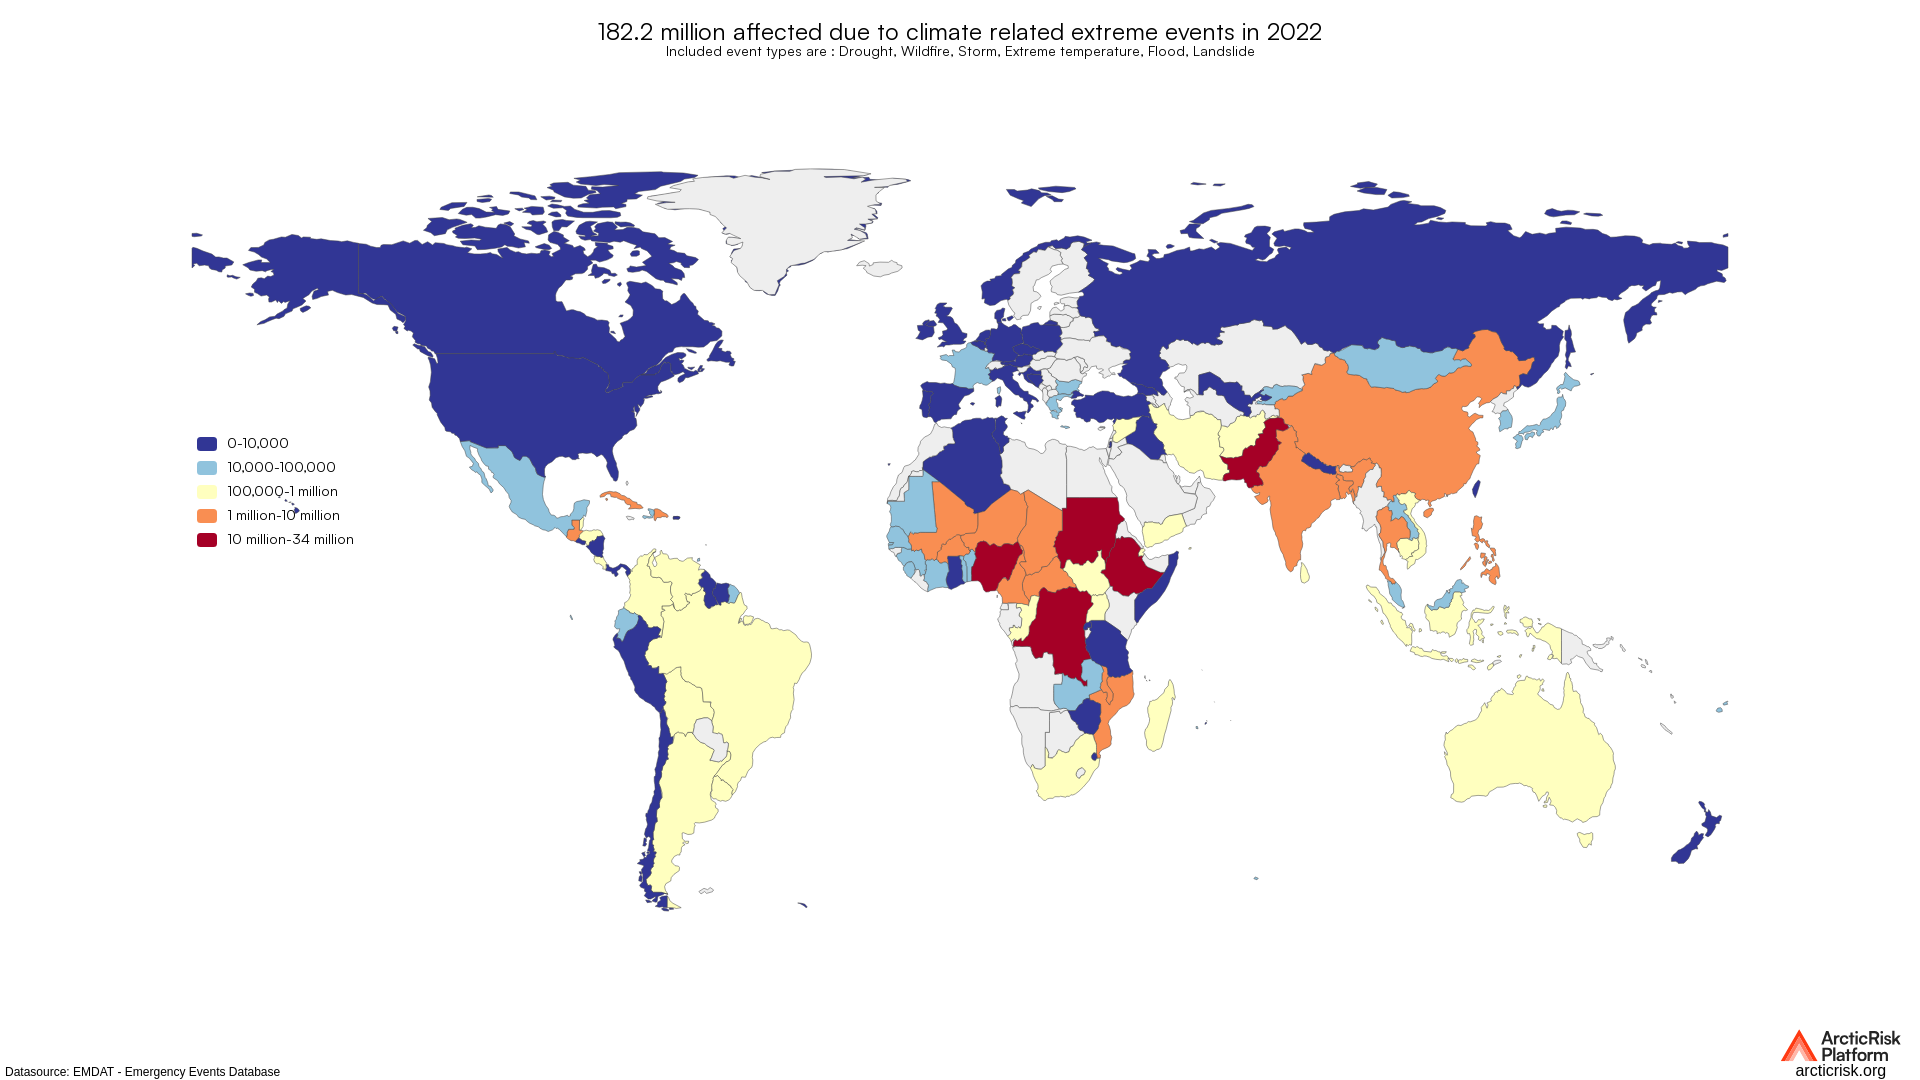
Shows economic damages in billion USD for the year of incident and social impact in terms of number of deaths and number of people affected…
The Germanwatch Global Climate Risk Index is an analysis based on one of the most reliable data sets avaiable on the impacts of extreme…
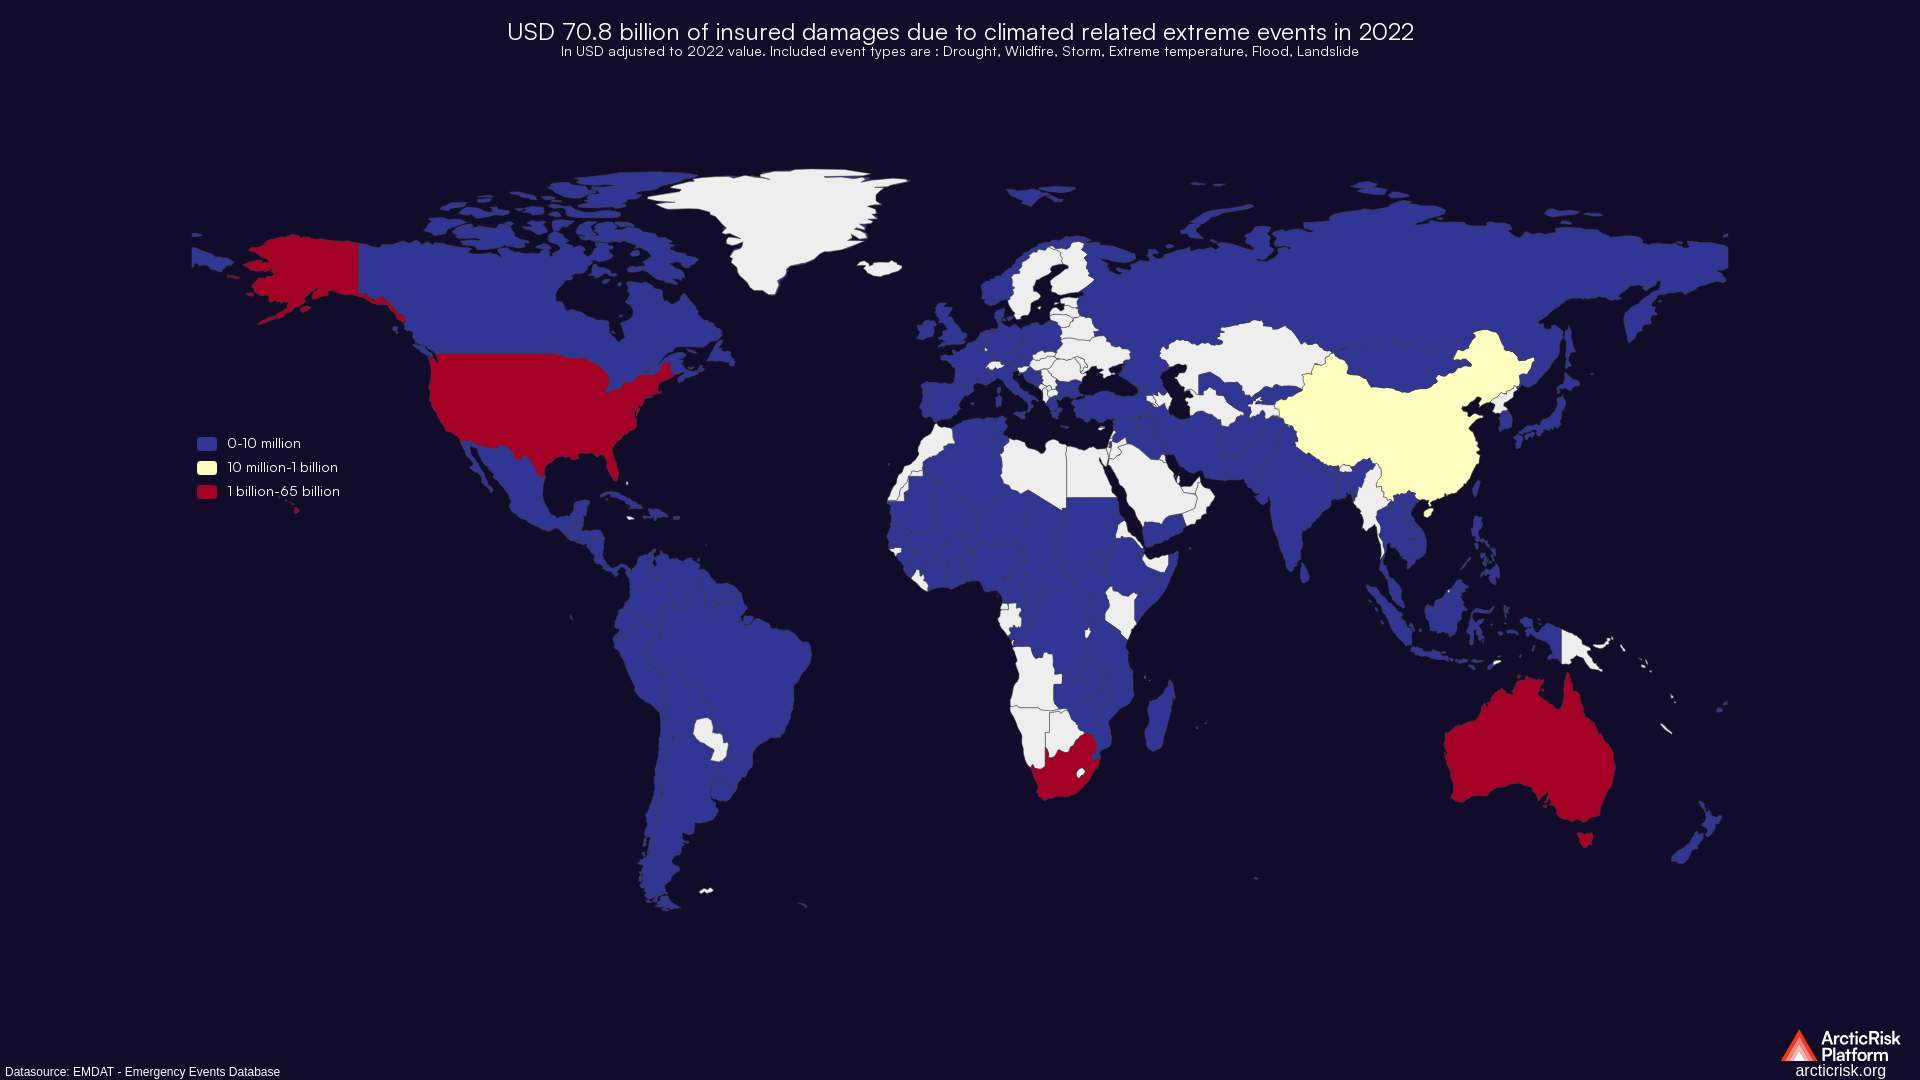
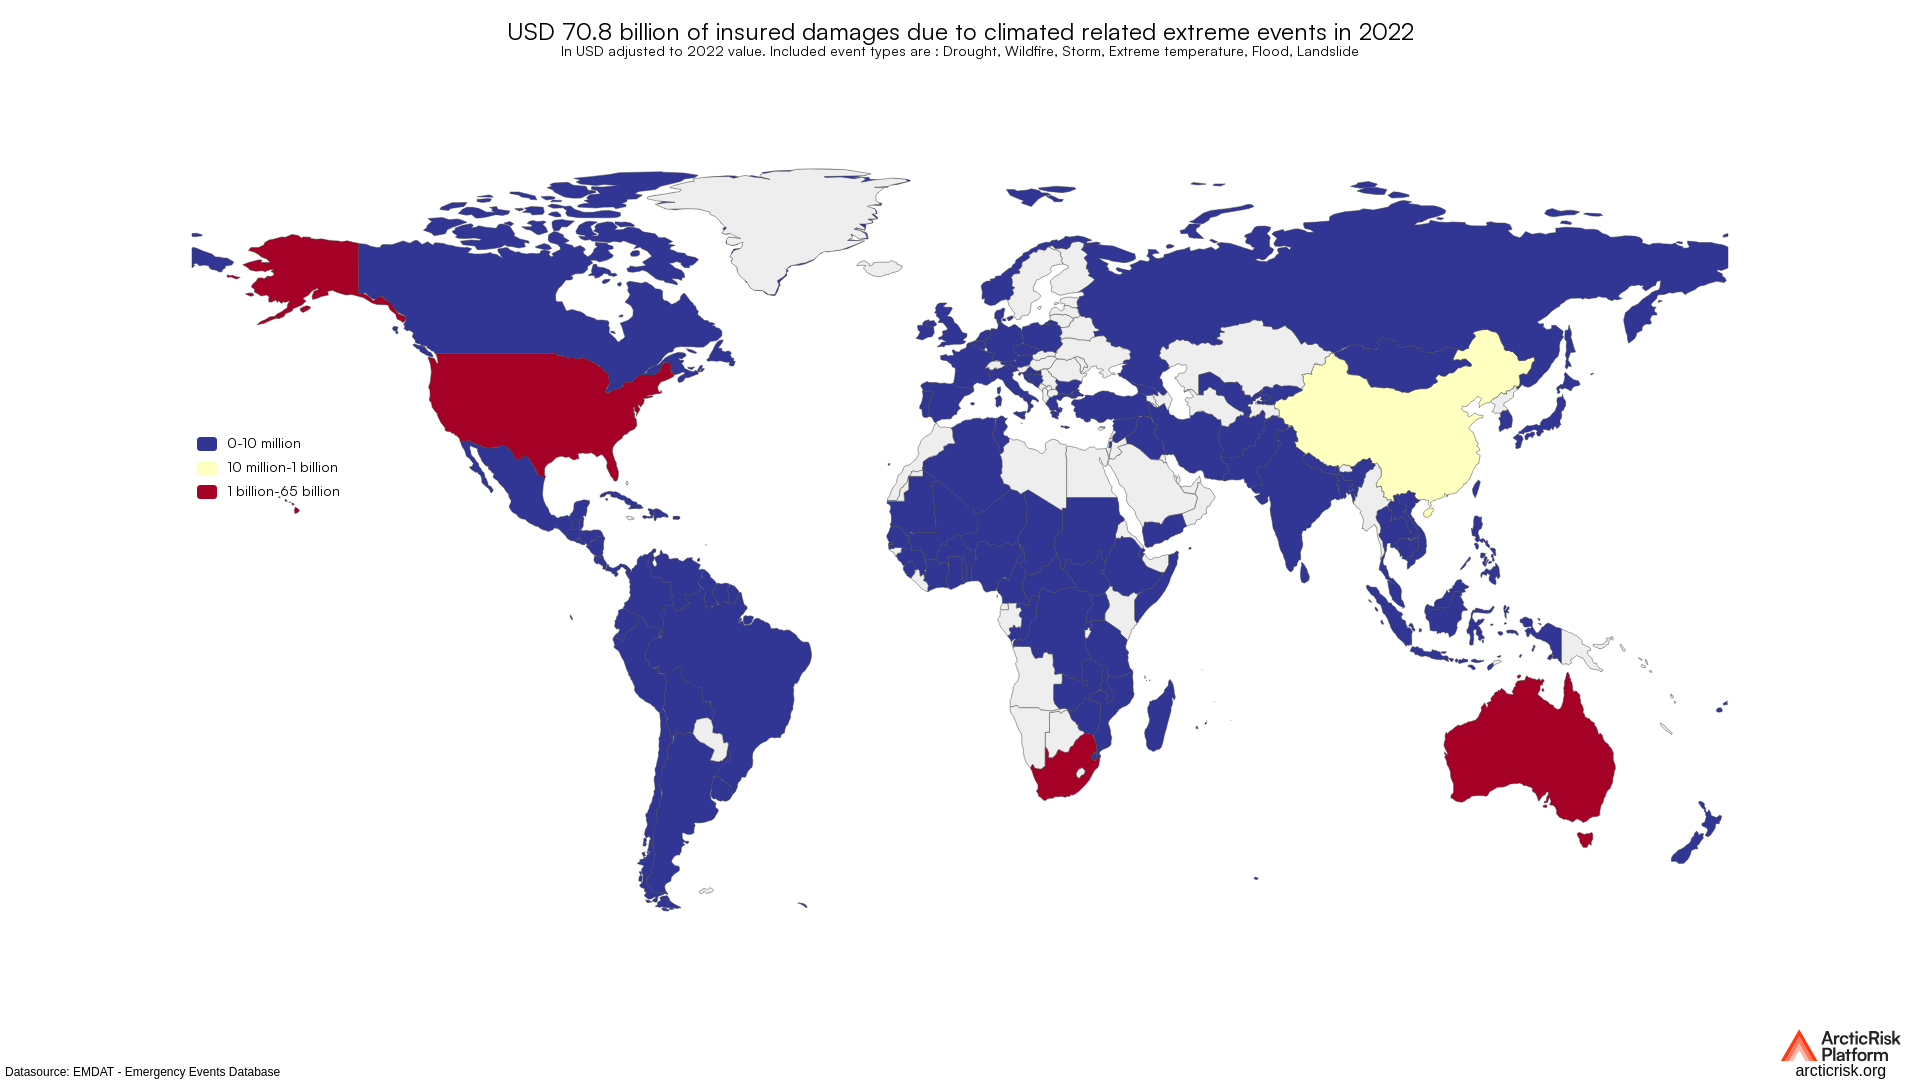
Shows economic damages in billion USD for the year of incident and social impact in terms of number of deaths and number of people affected…


Shows economic damages in billion USD for the year of incident and social impact in terms of number of deaths and number of people affected…


Shows economic damages in billion USD for the year of incident and social impact in terms of number of deaths and number of people affected…


Shows economic damages in billion USD for the year of incident and social impact in terms of number of deaths and number of people affected…
Shows economic damages in billion USD for the year of incident and social impact in terms of number of deaths and number of people affected…
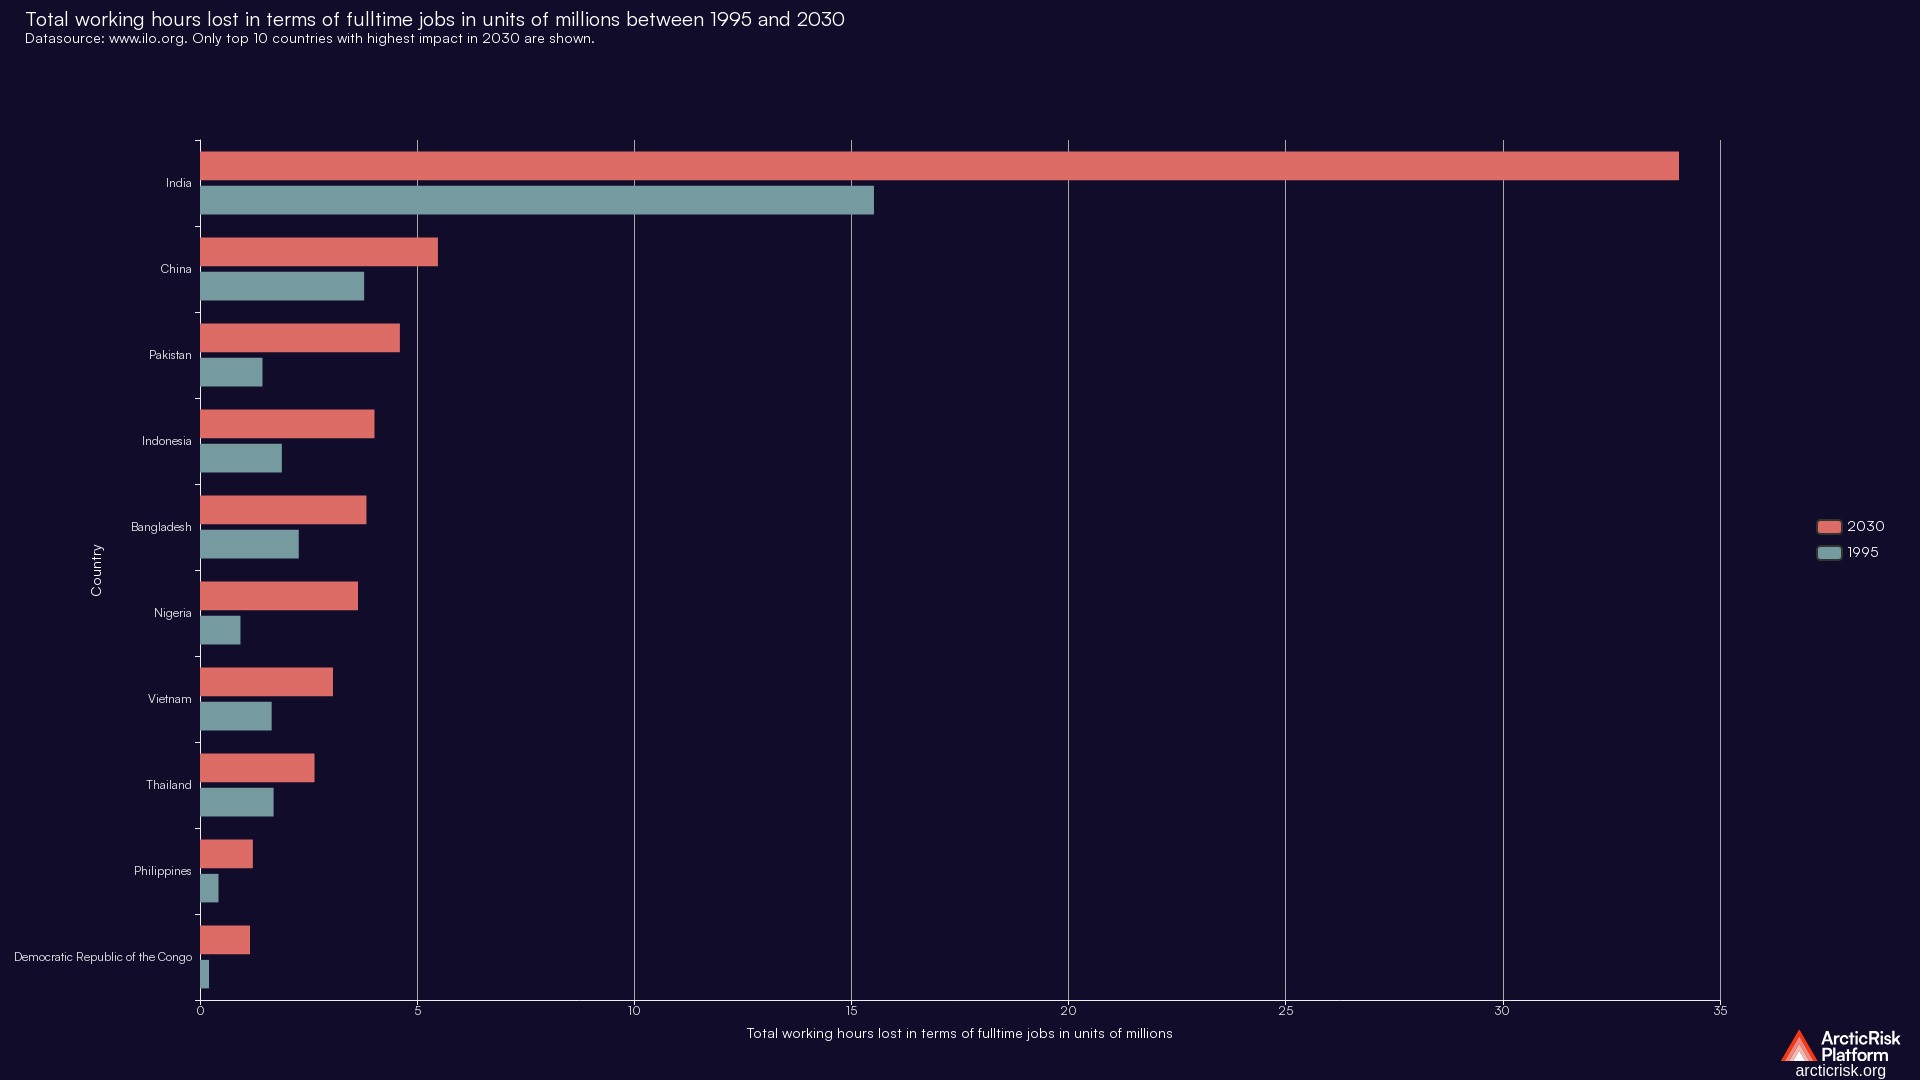
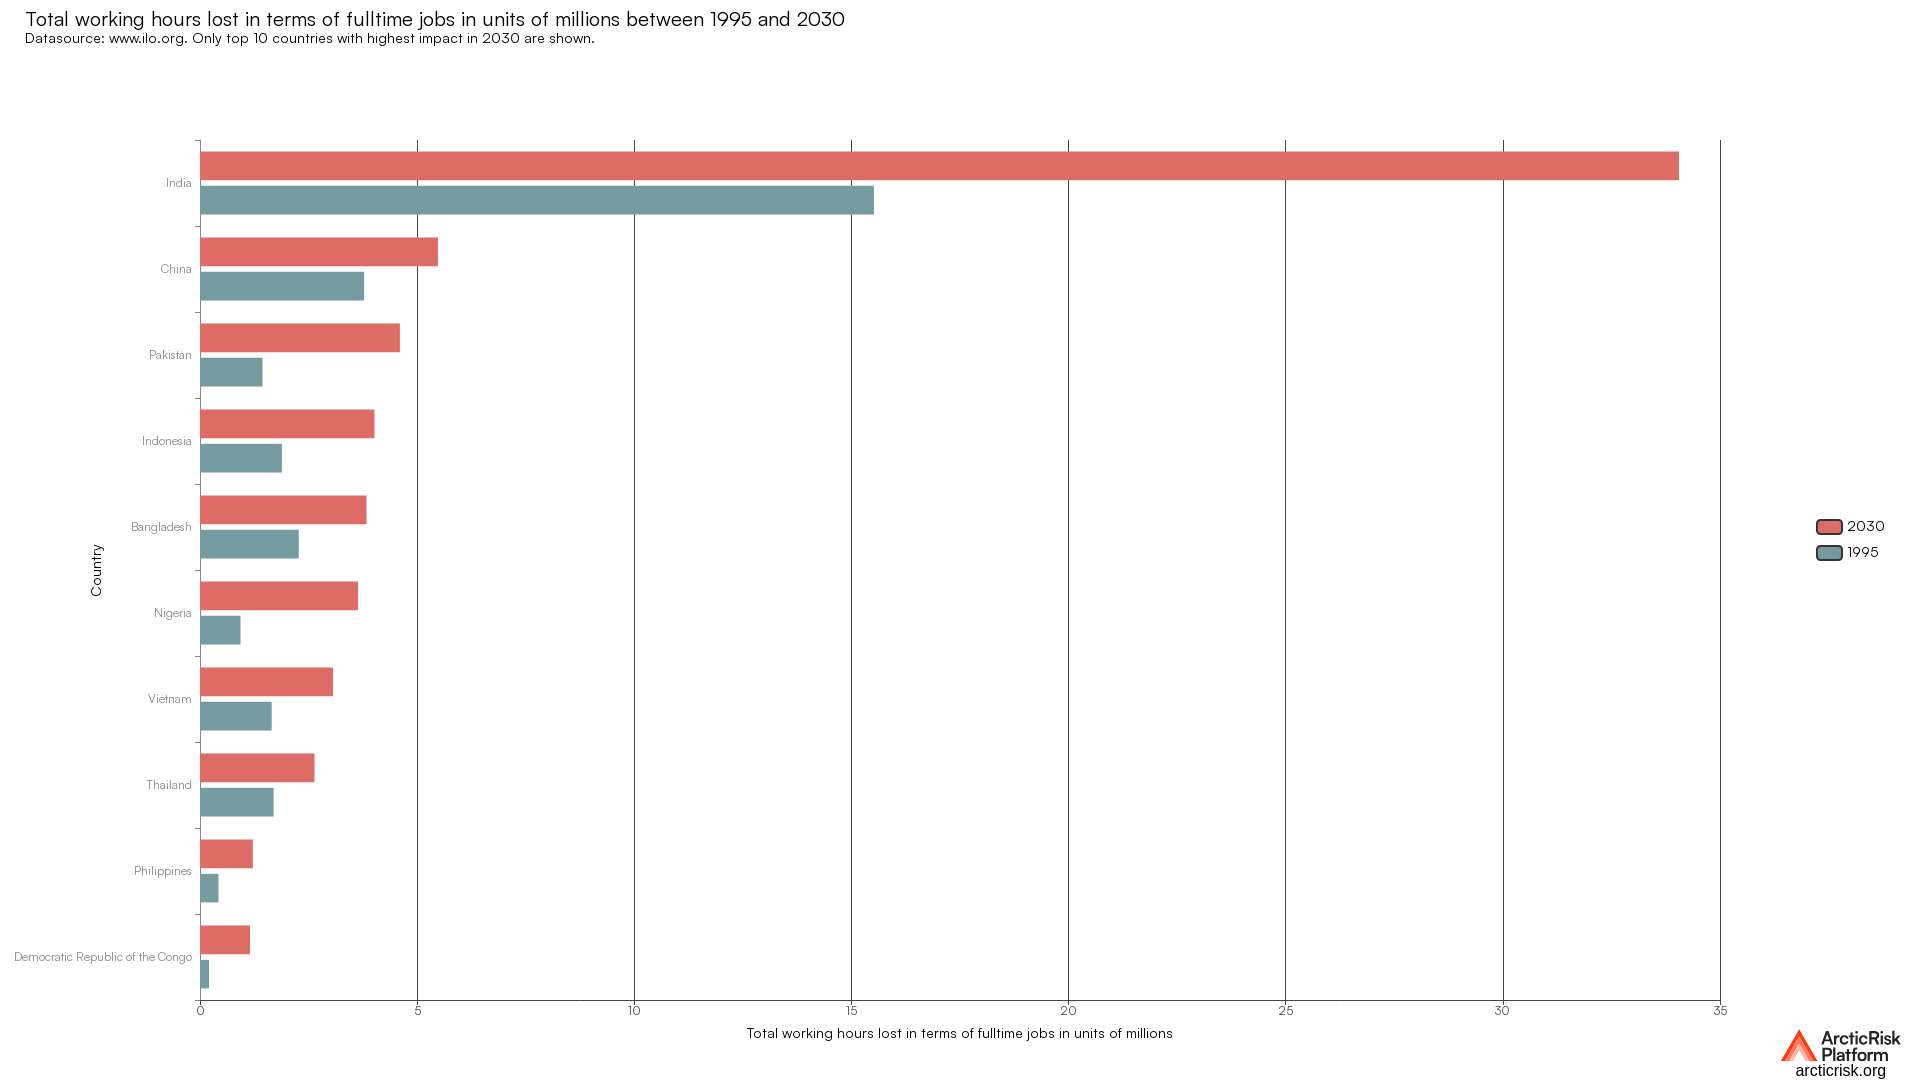
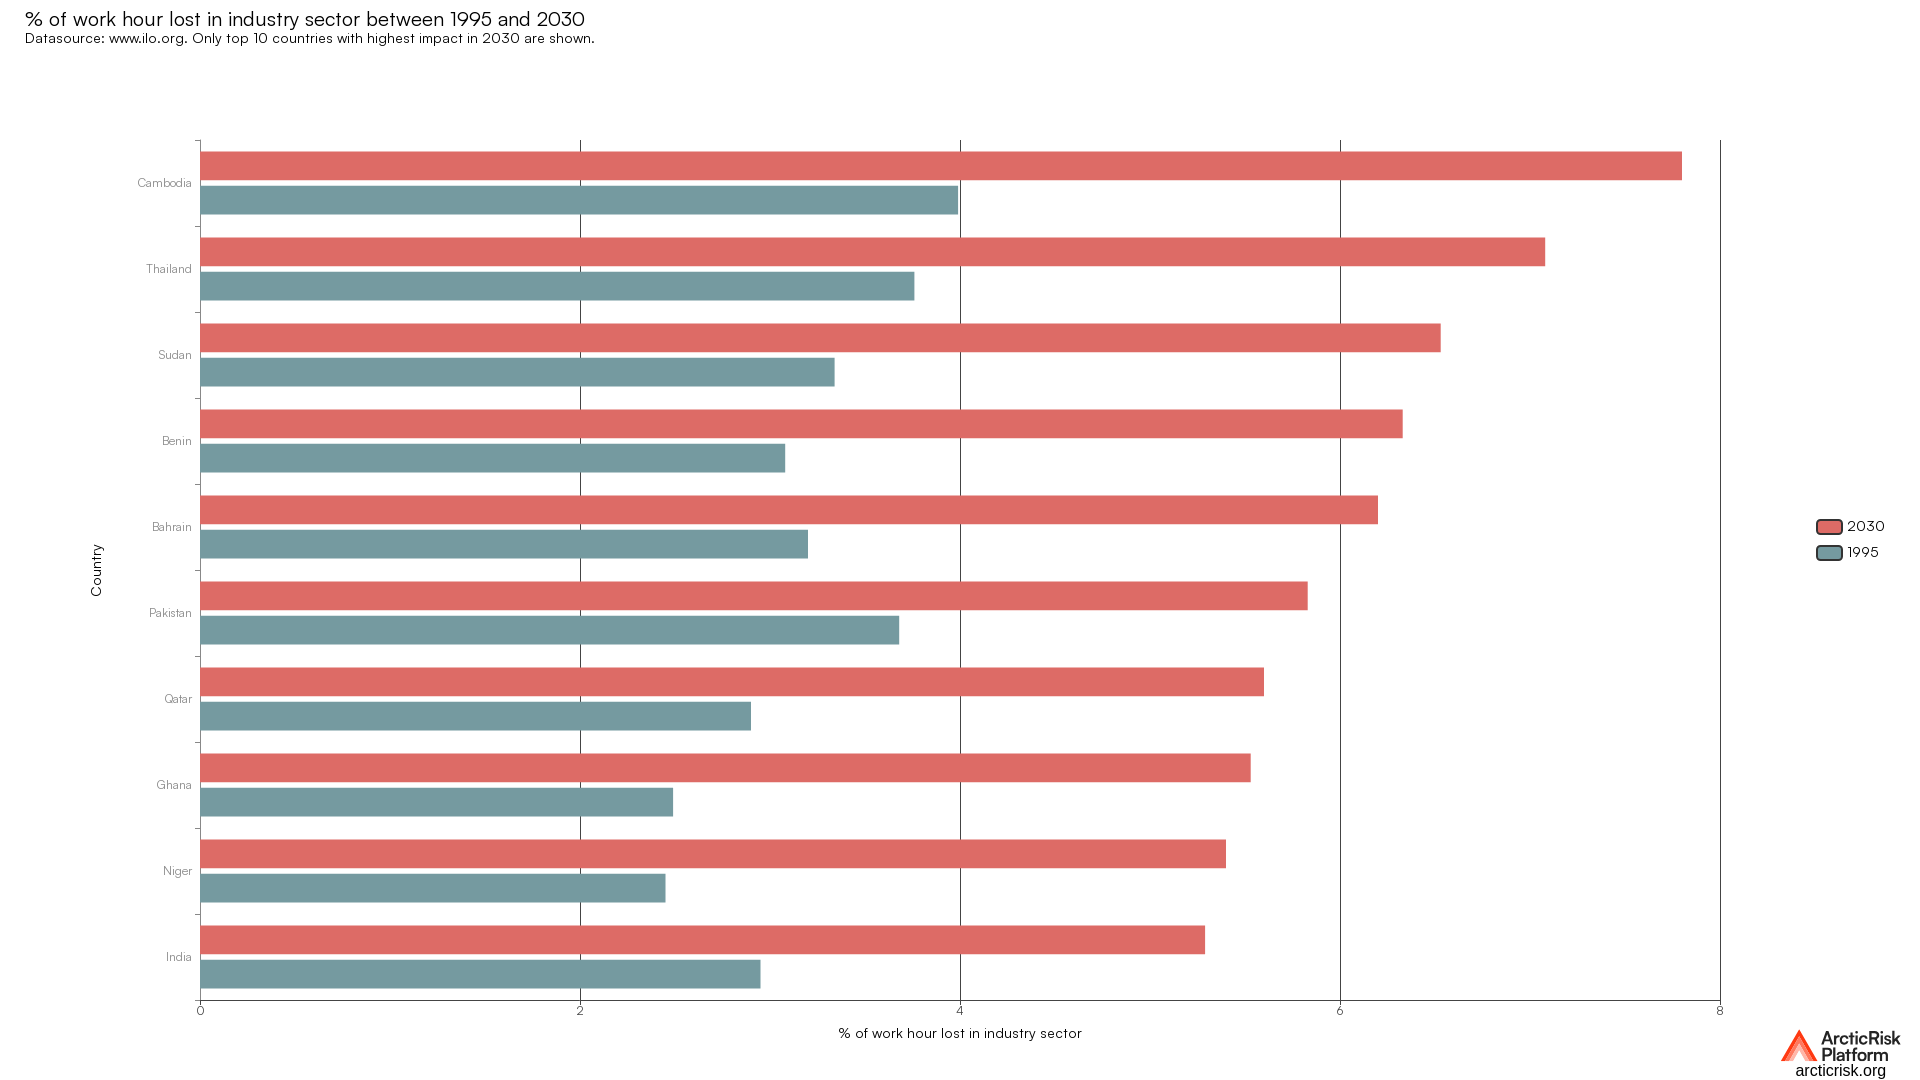
This dataset shwos the extent to which heat stress affects labour productivity, measured in terms of working hours, in virtually every cou…
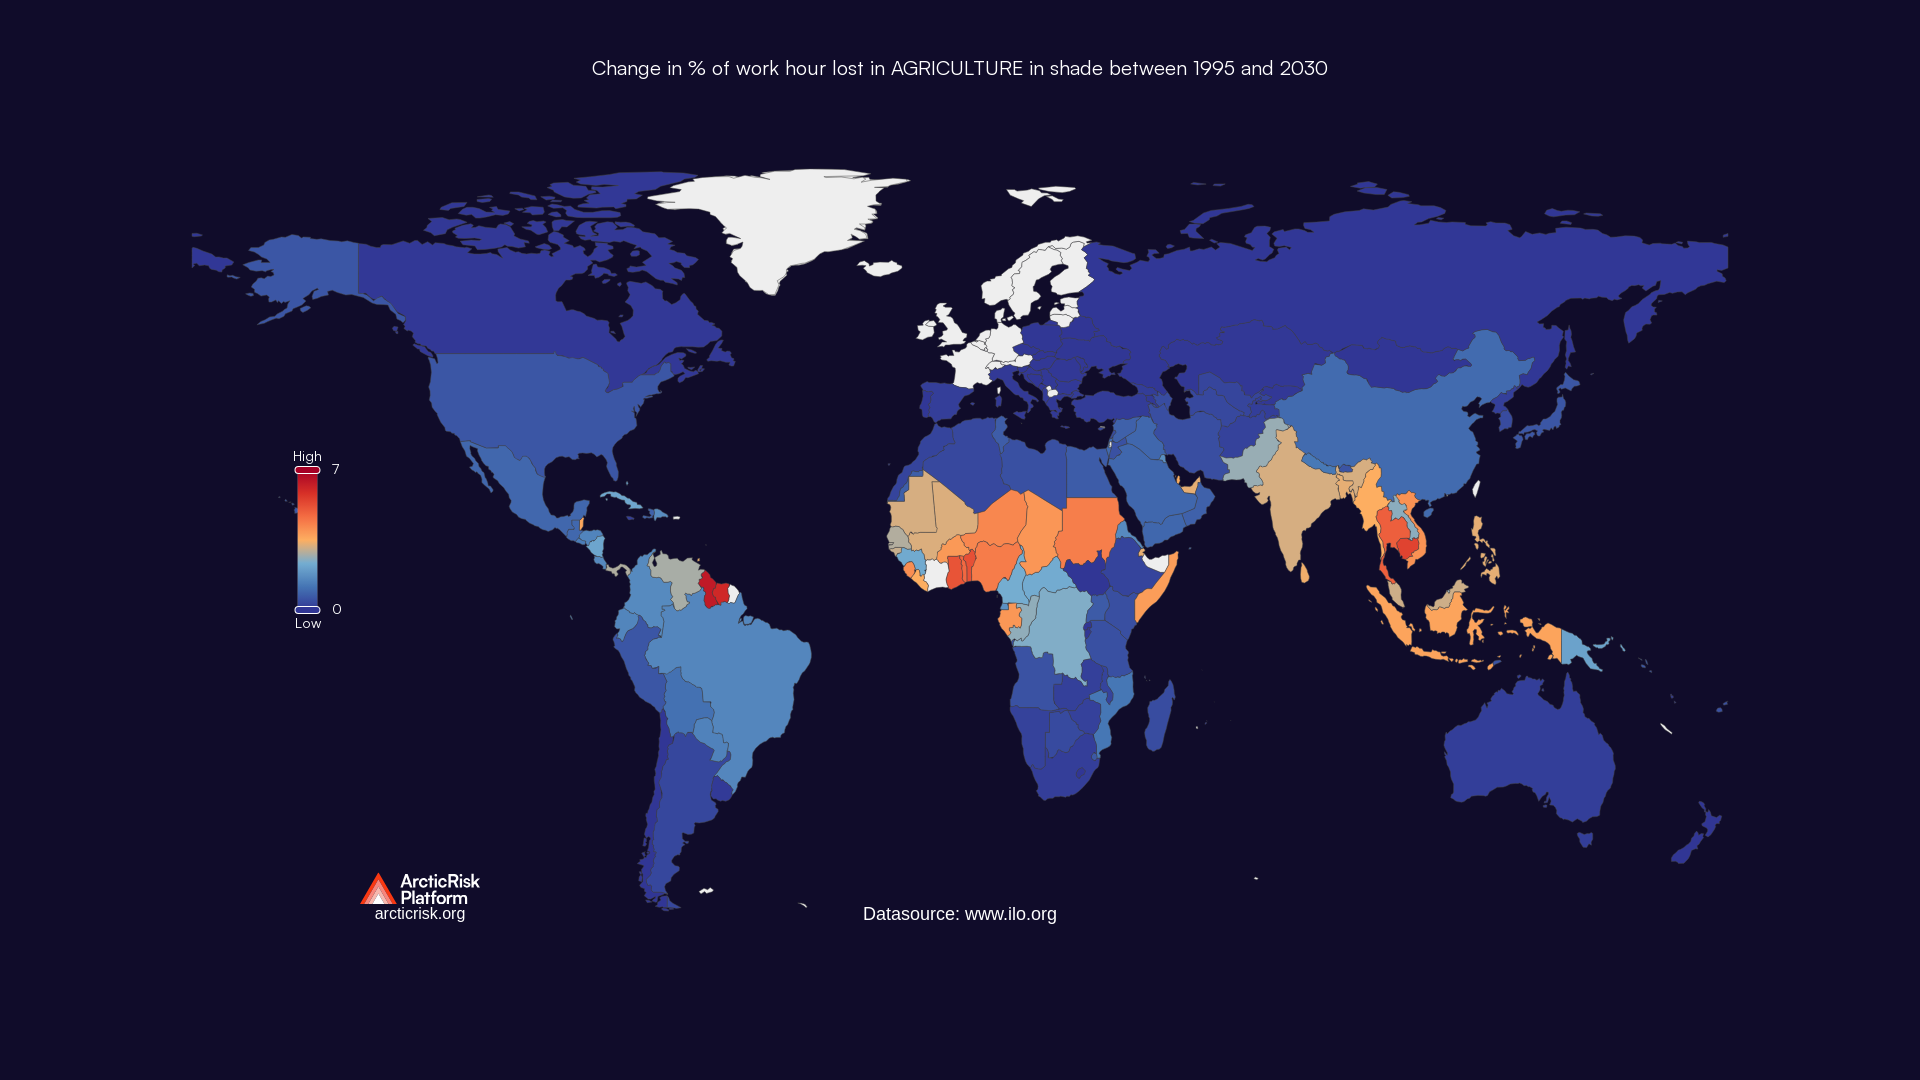
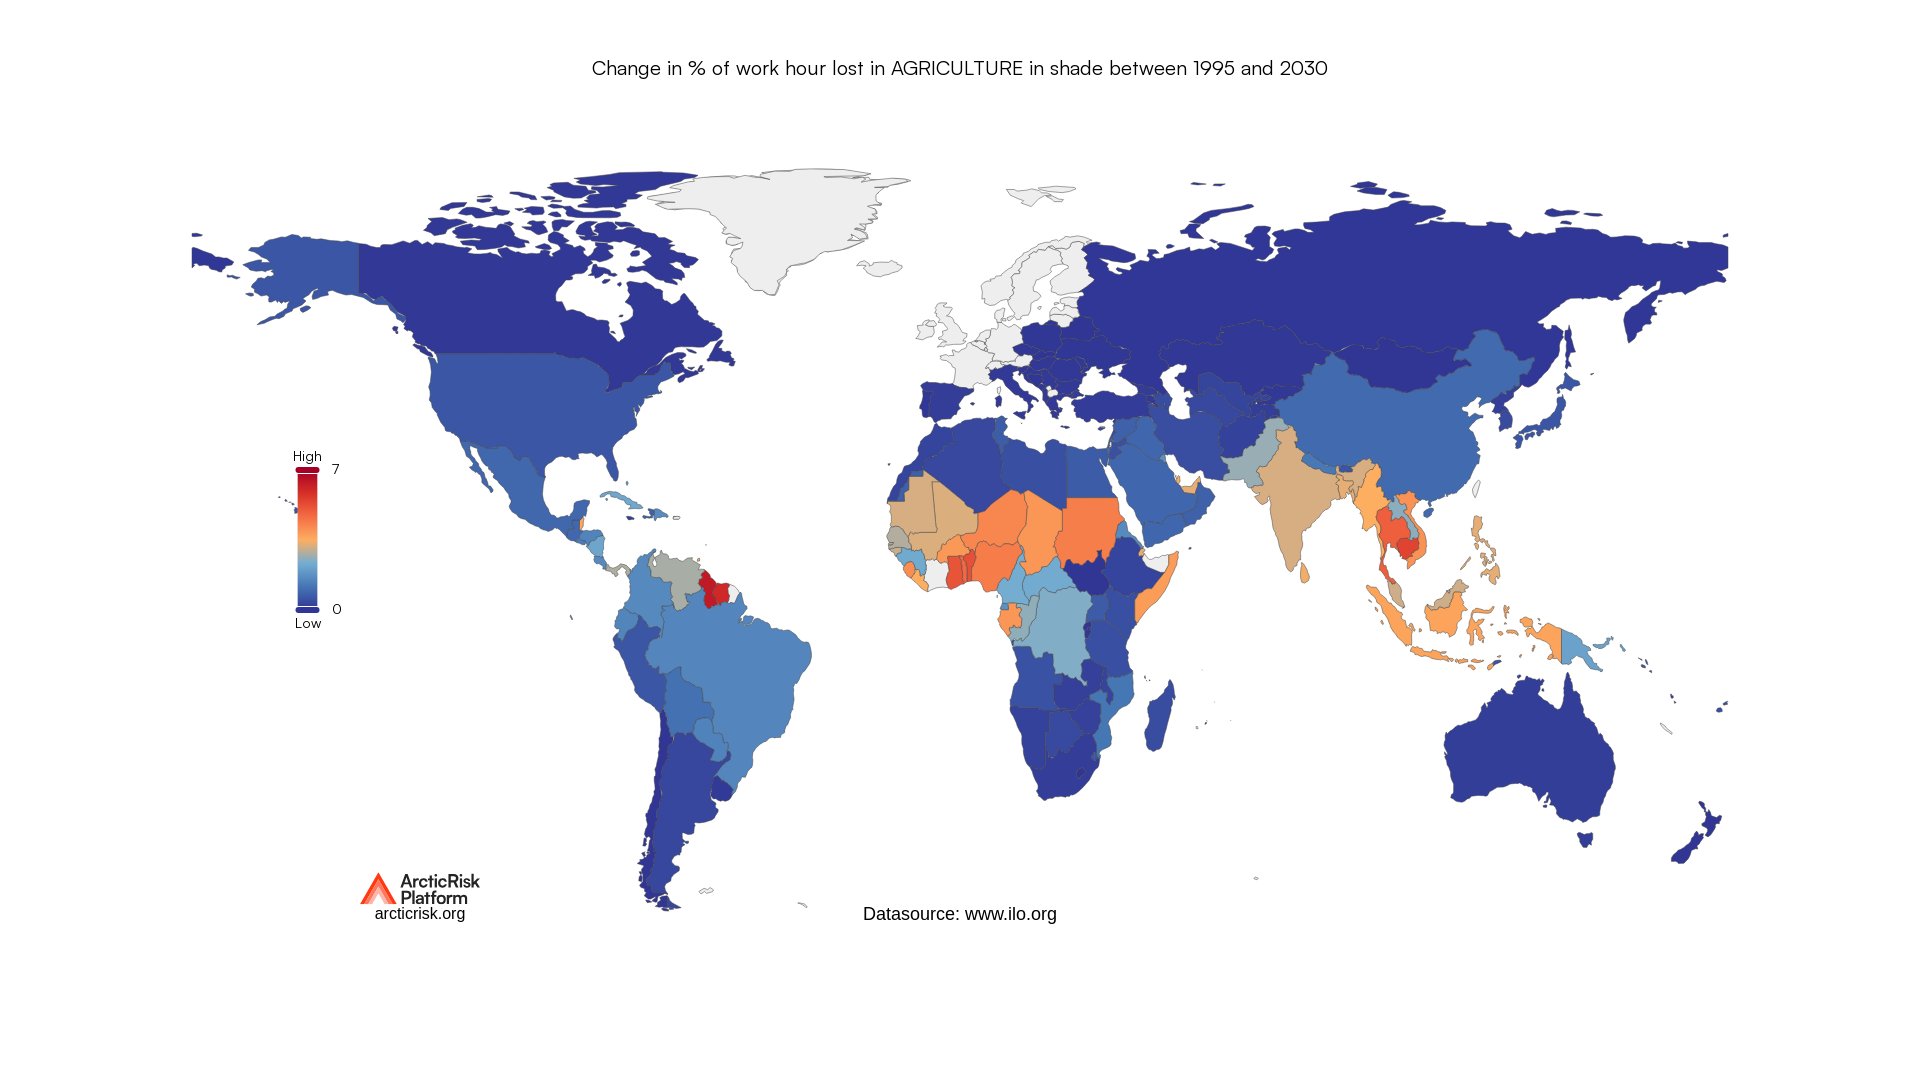
This dataset shwos the extent to which heat stress affects labour productivity, measured in terms of working hours, in virtually every cou…
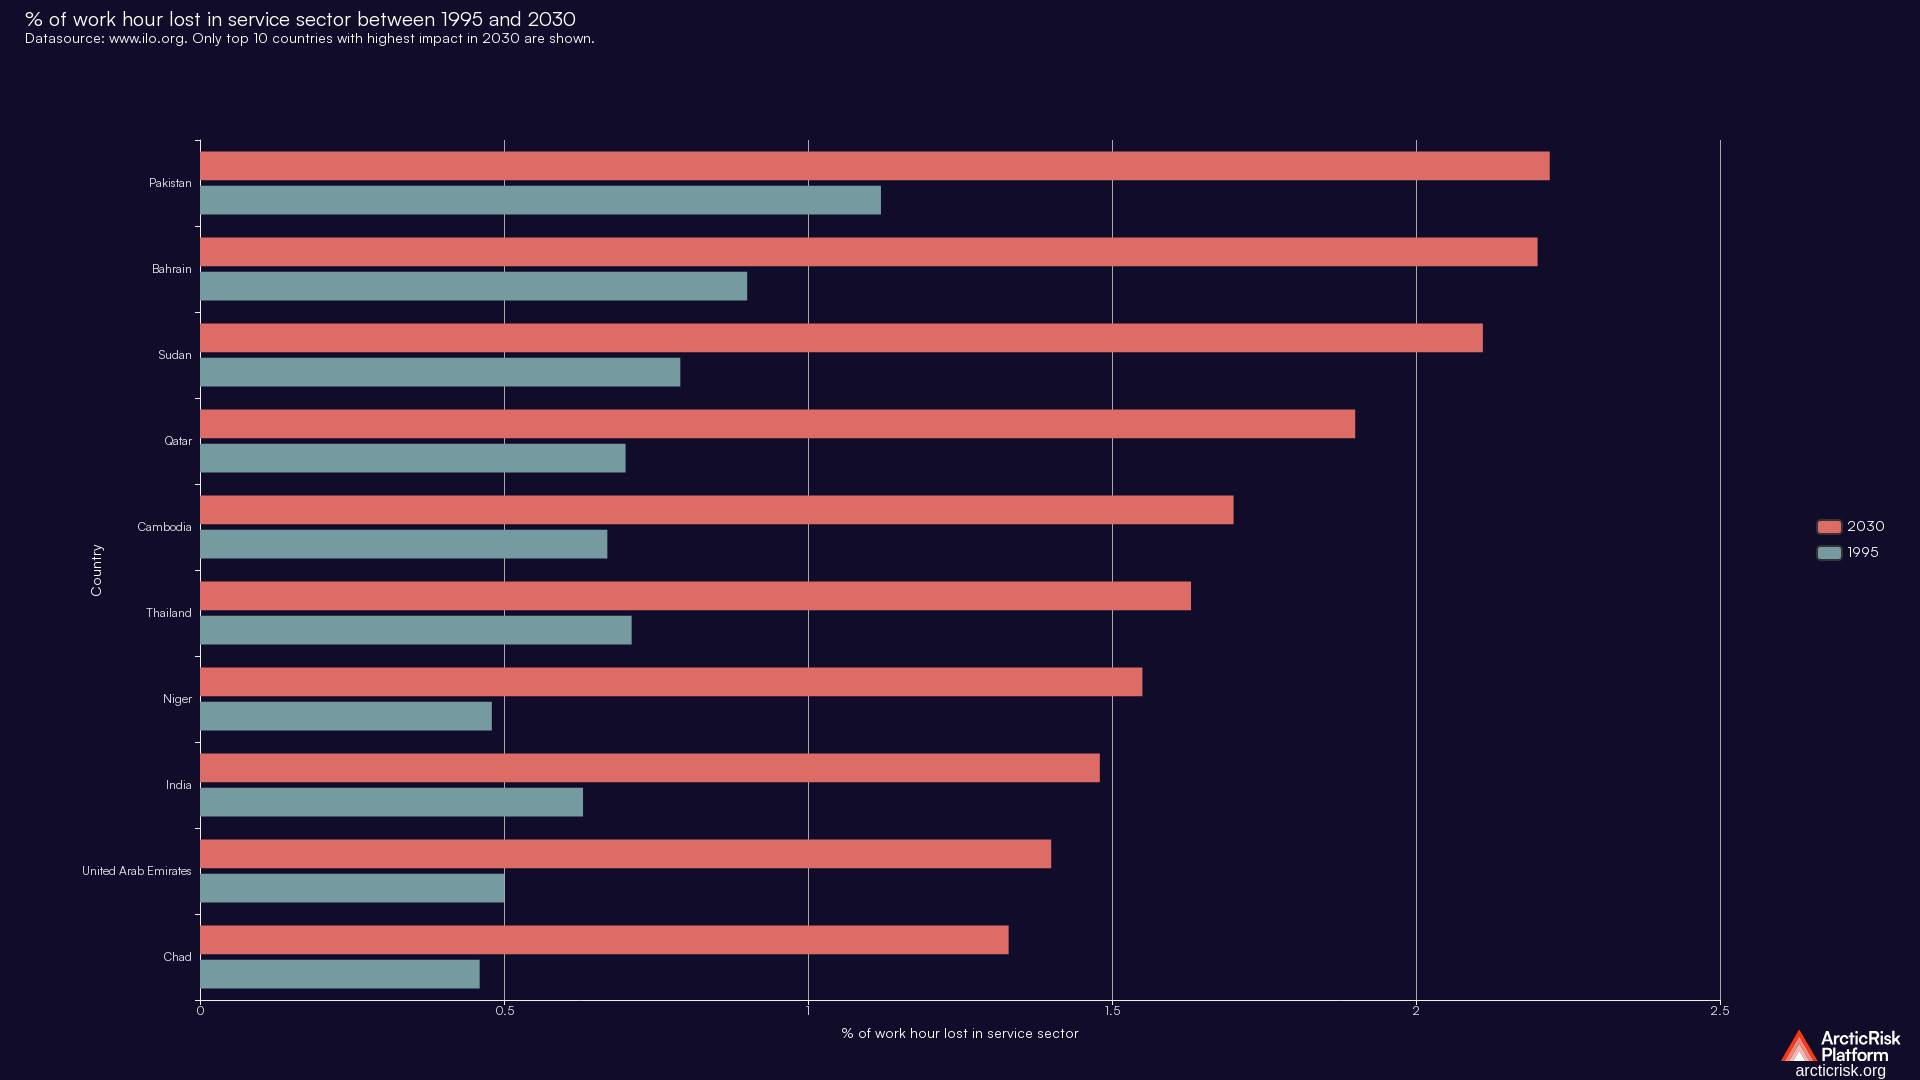
This dataset shwos the extent to which heat stress affects labour productivity, measured in terms of working hours, in virtually every cou…
This dataset shwos the extent to which heat stress affects labour productivity, measured in terms of working hours, in virtually every cou…