FREEZE: Climate Data Explorer
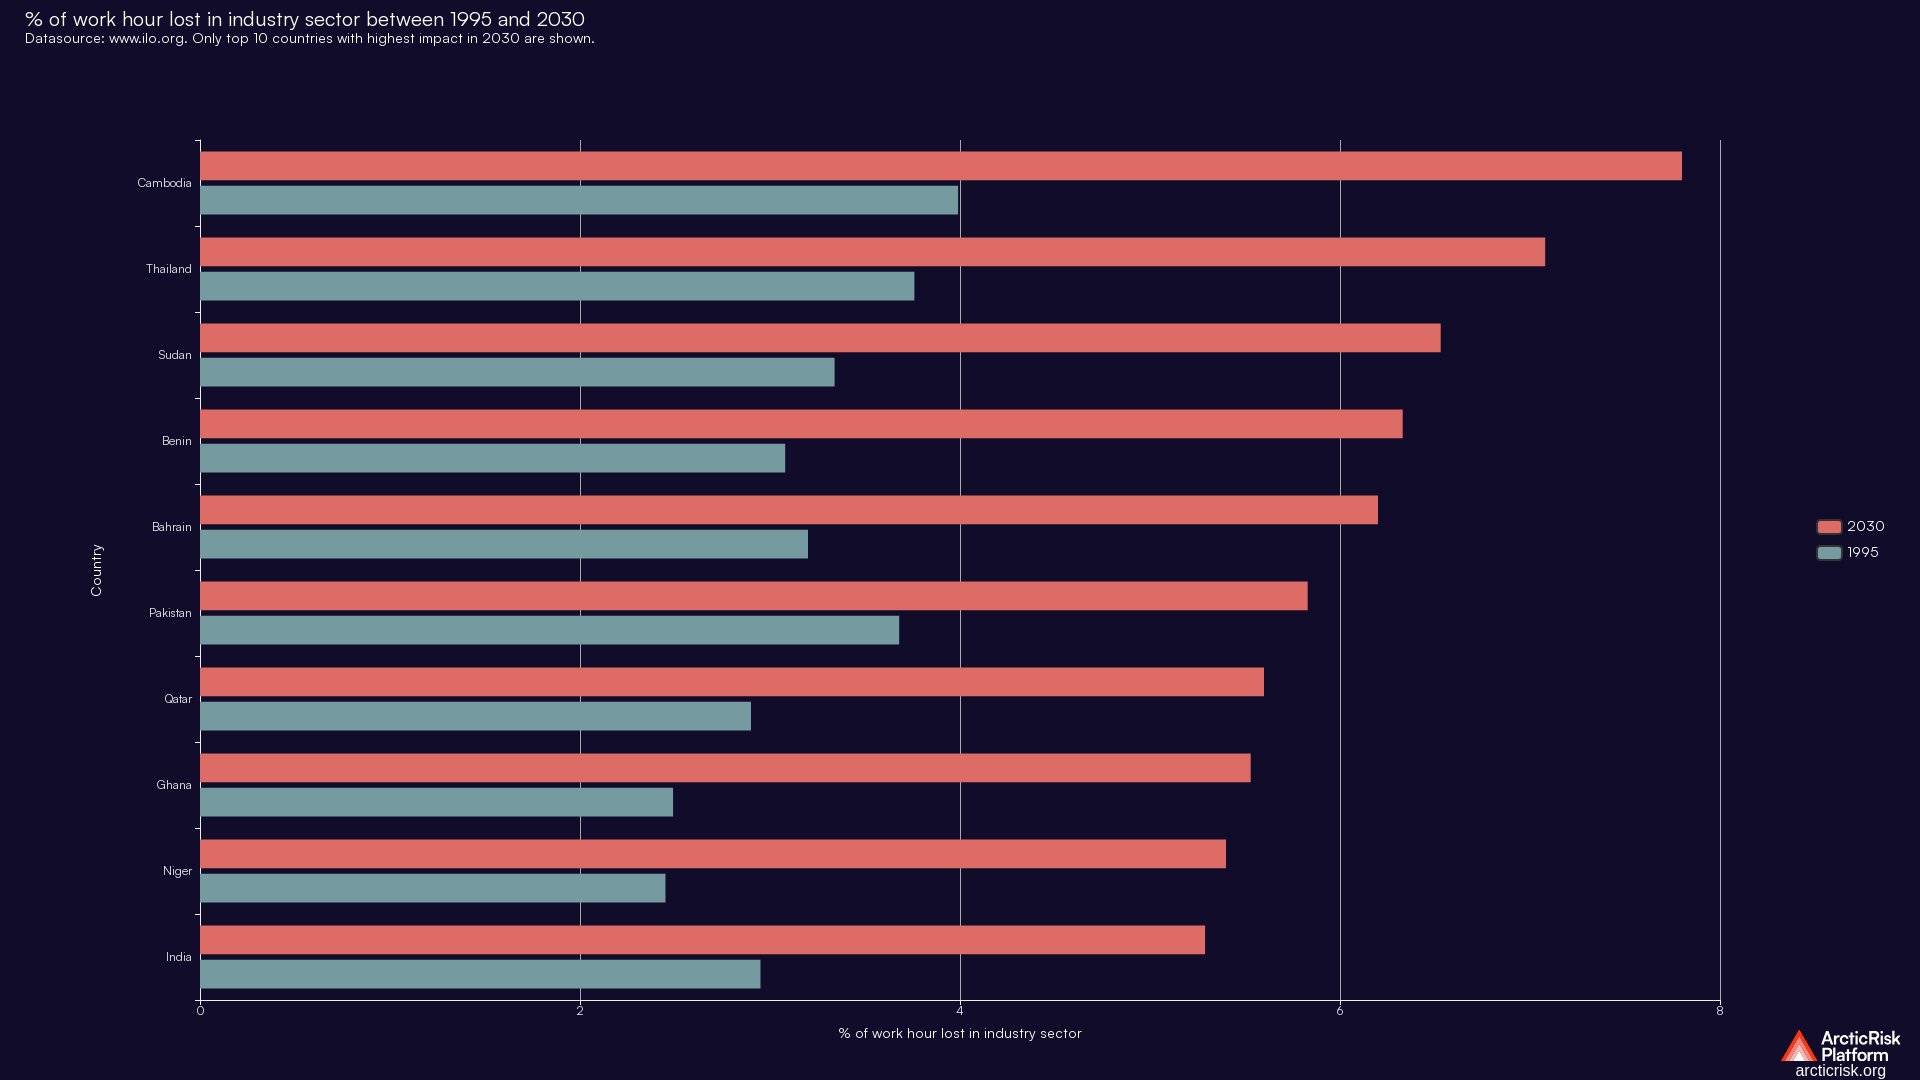
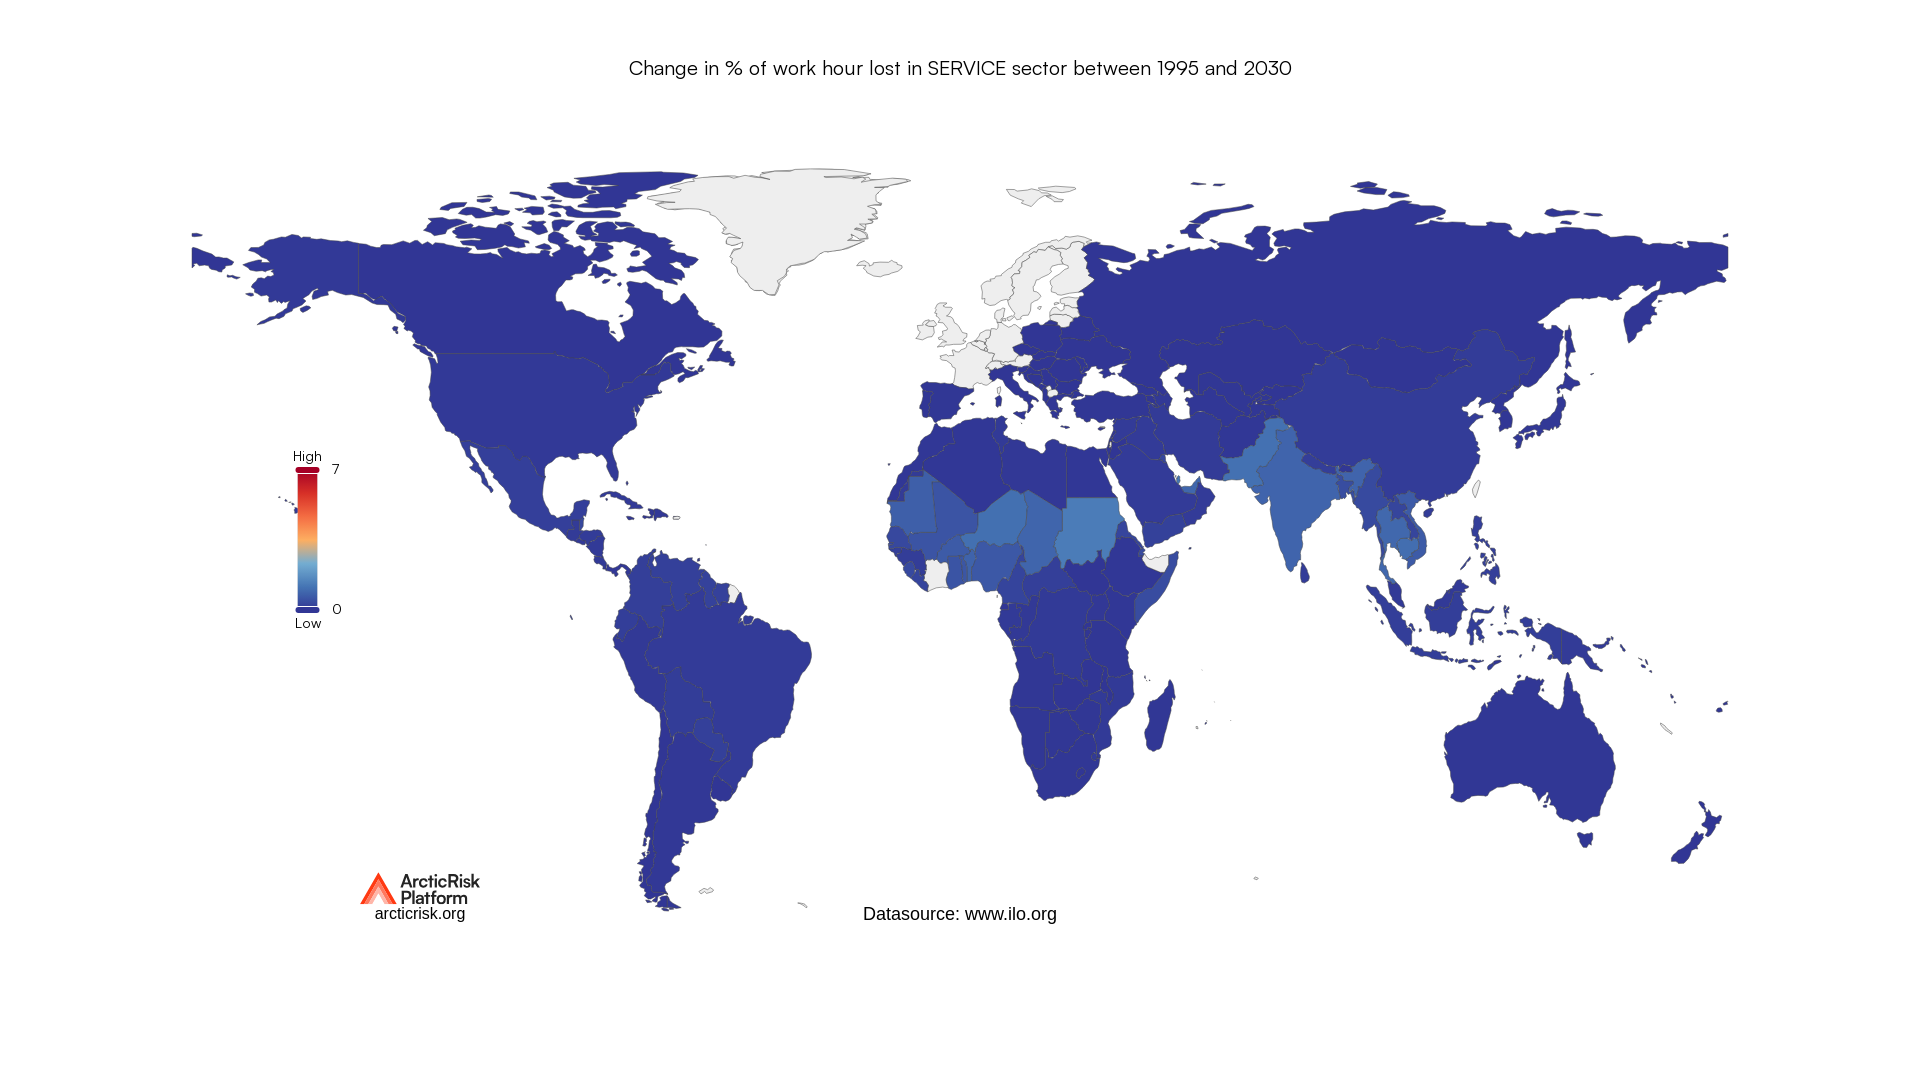
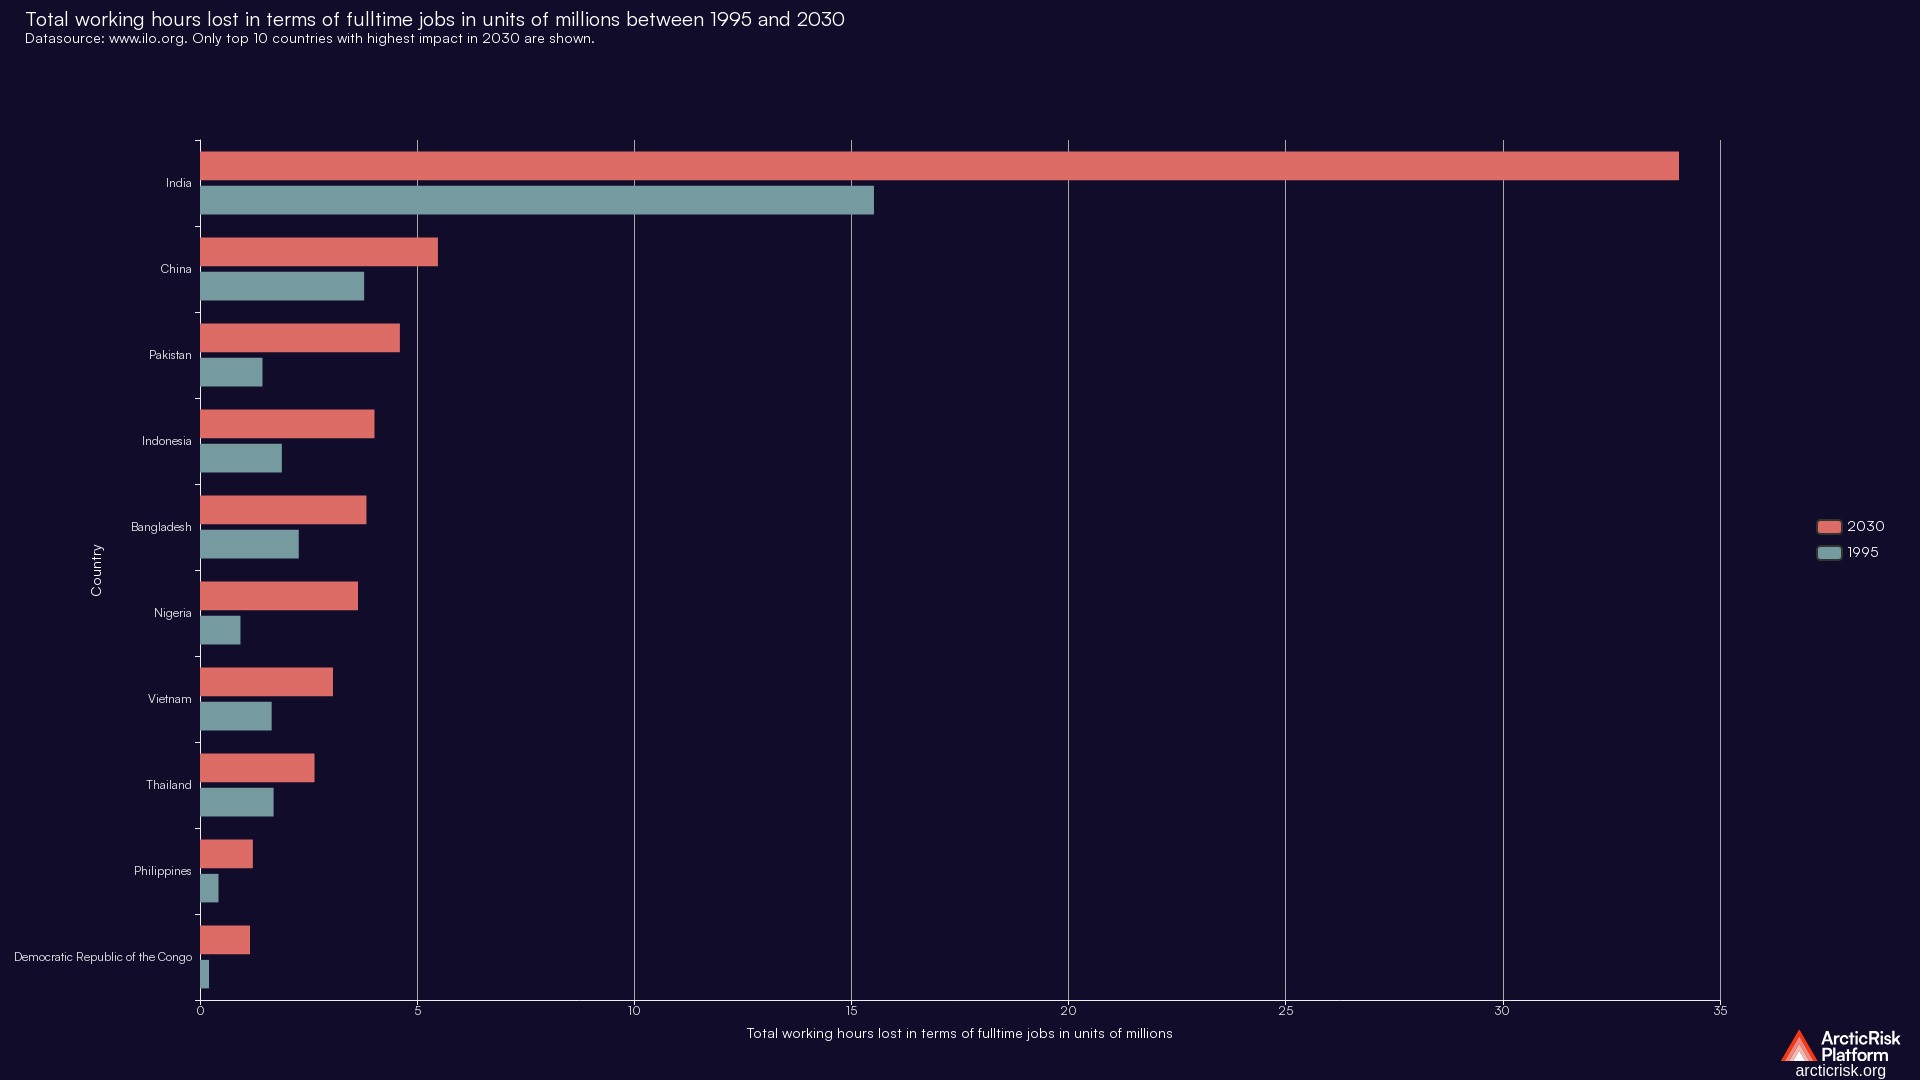
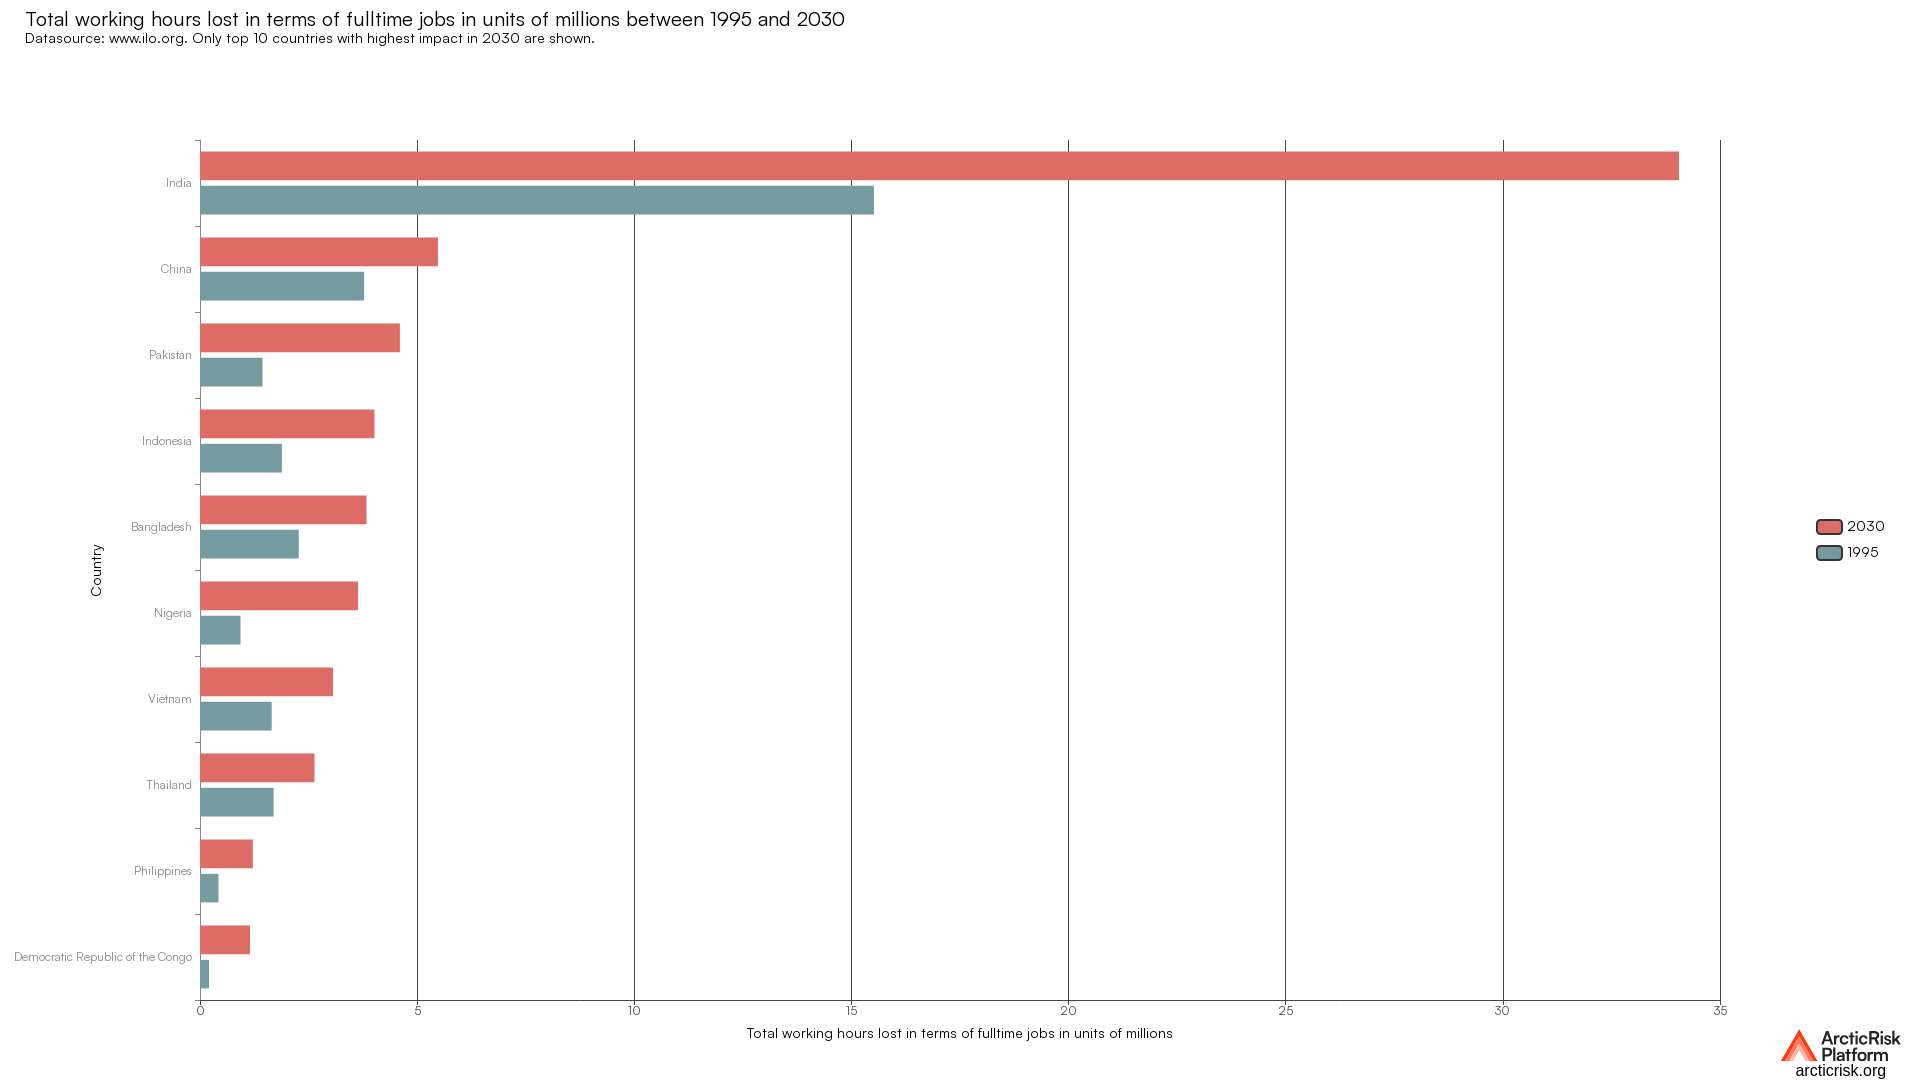
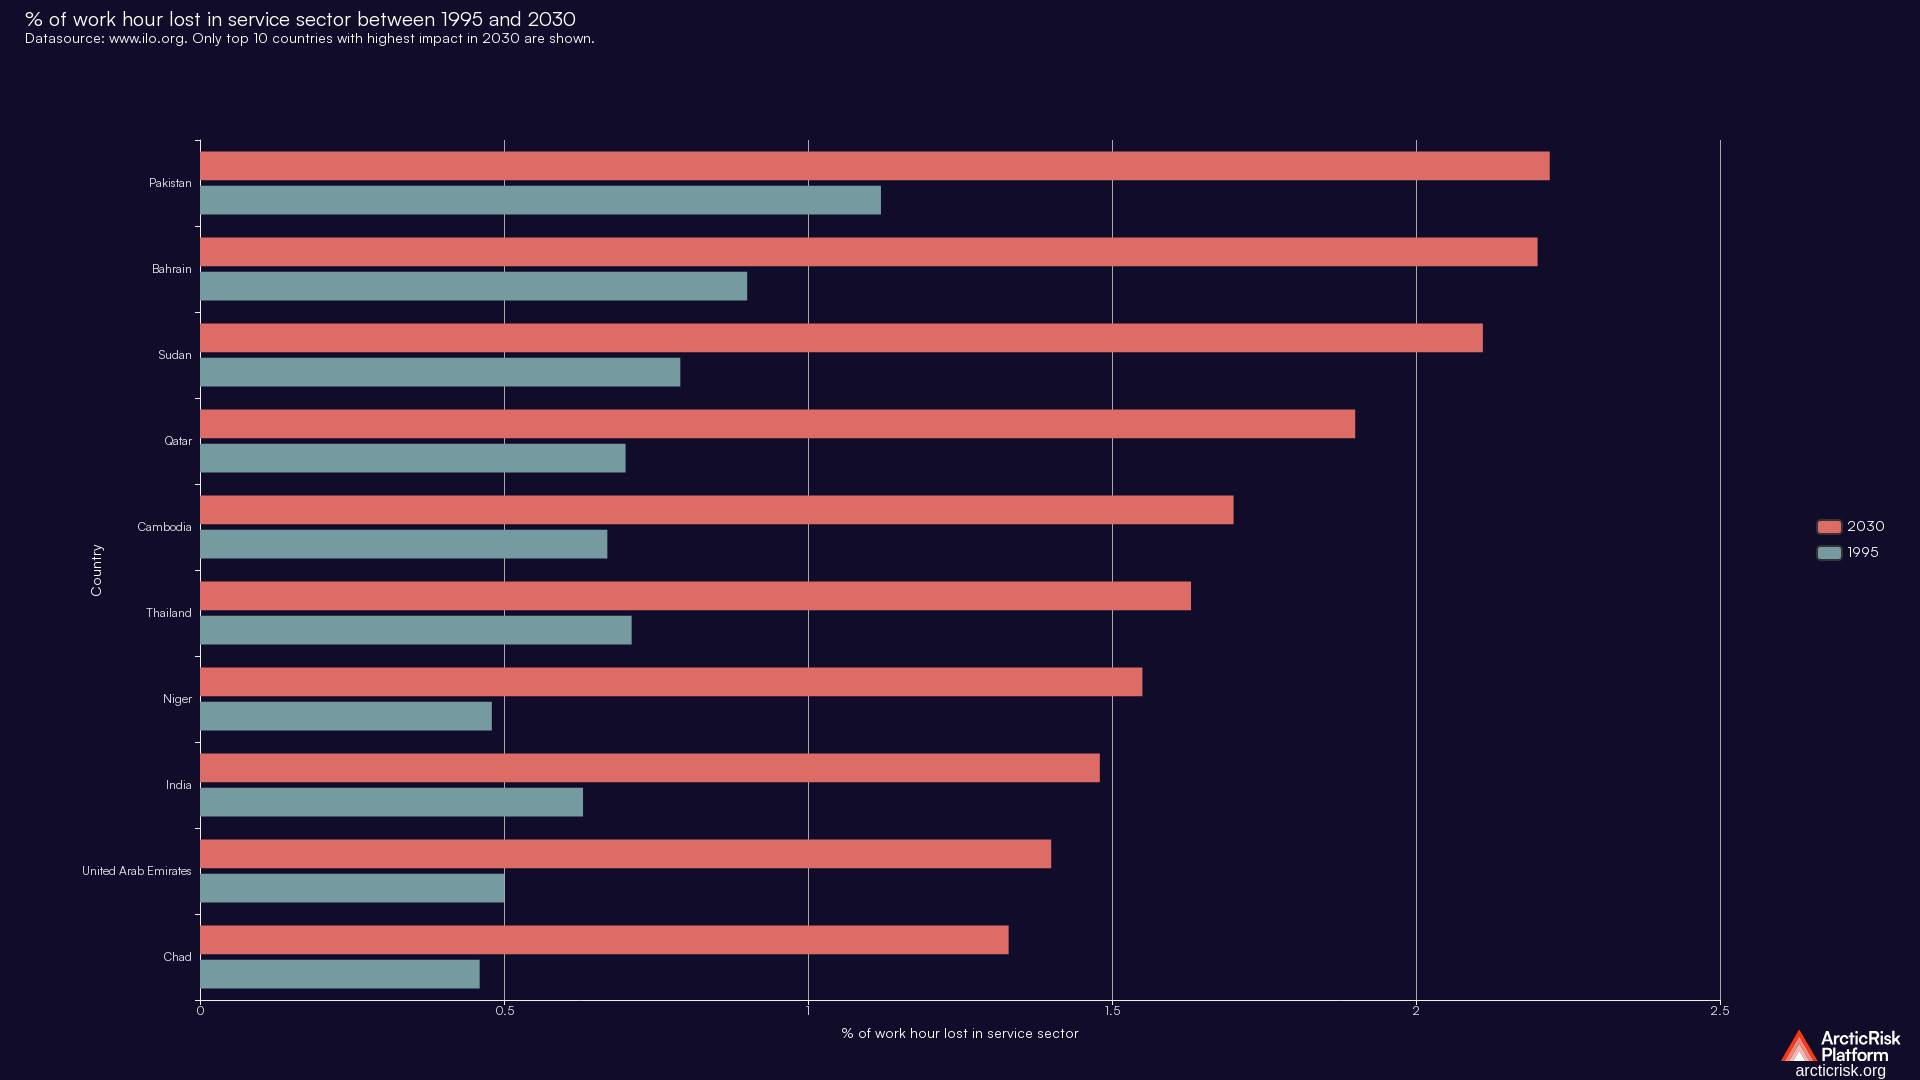
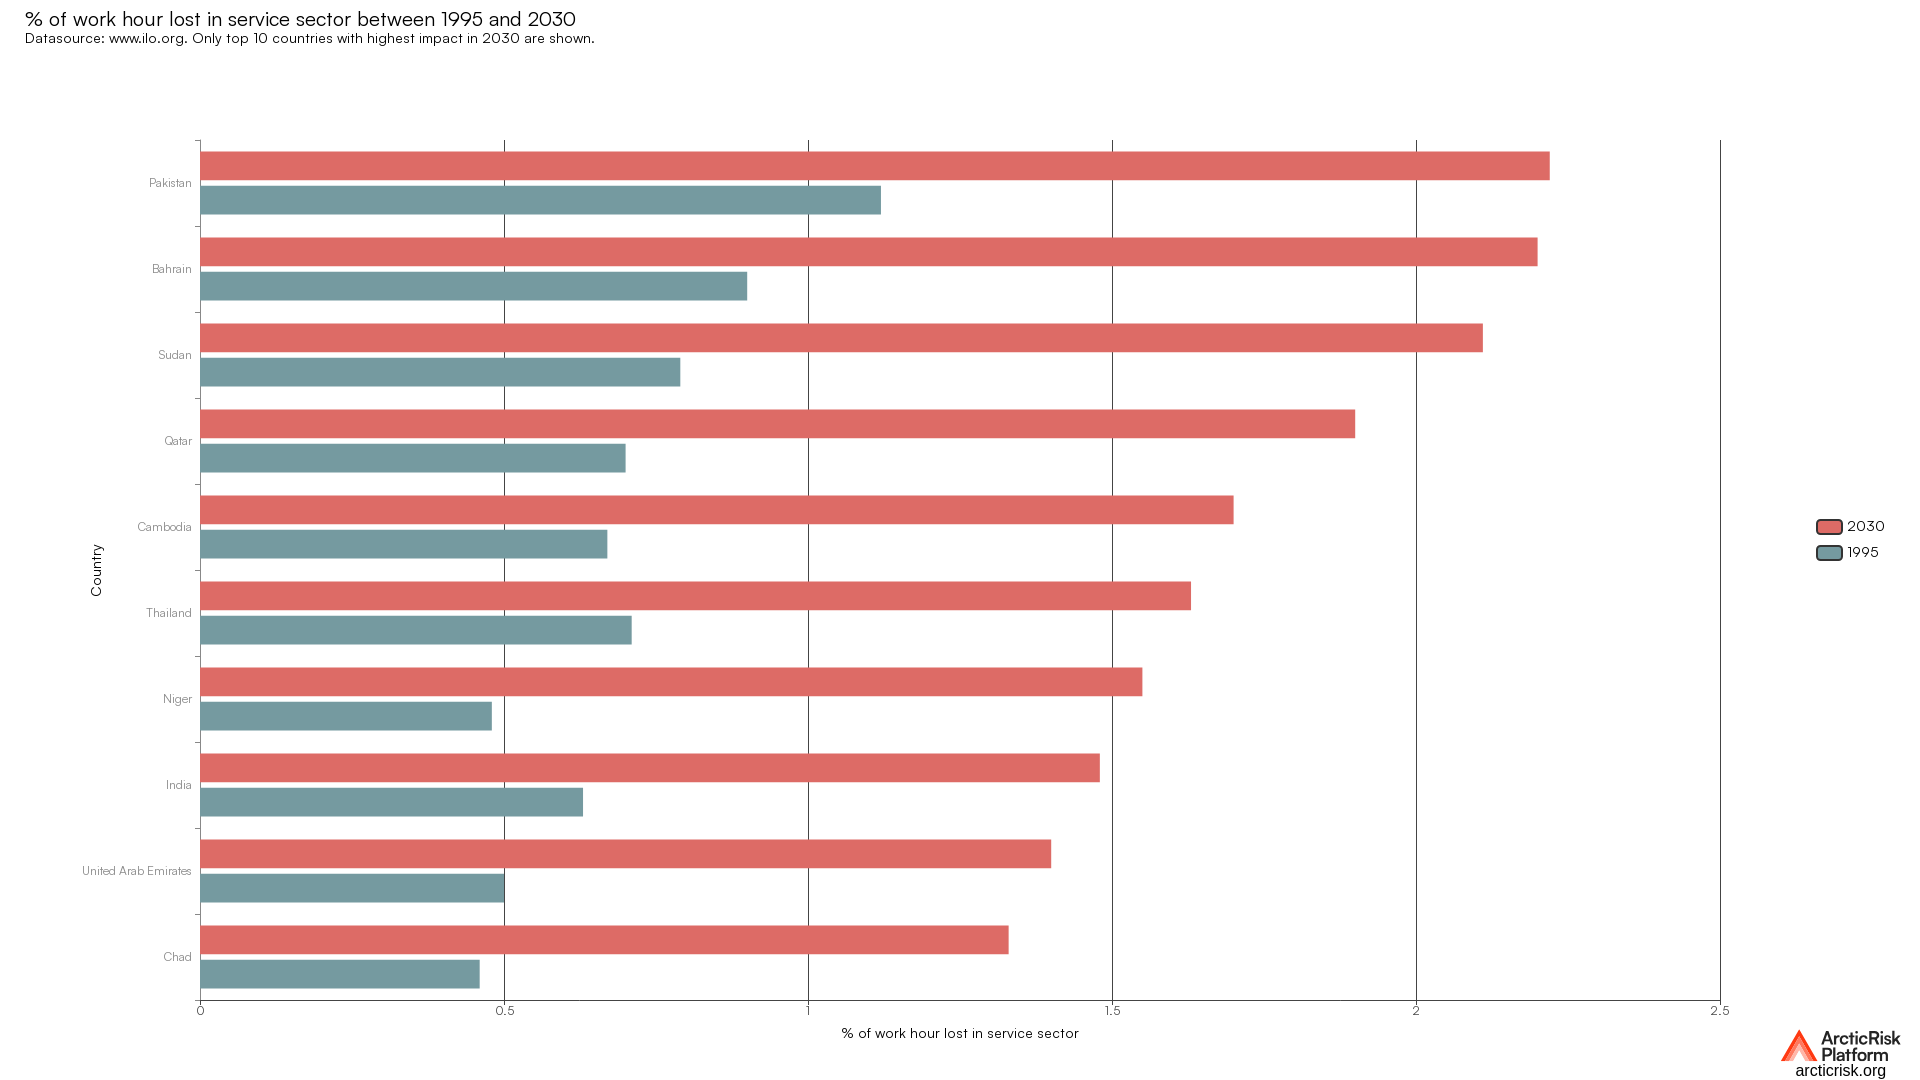
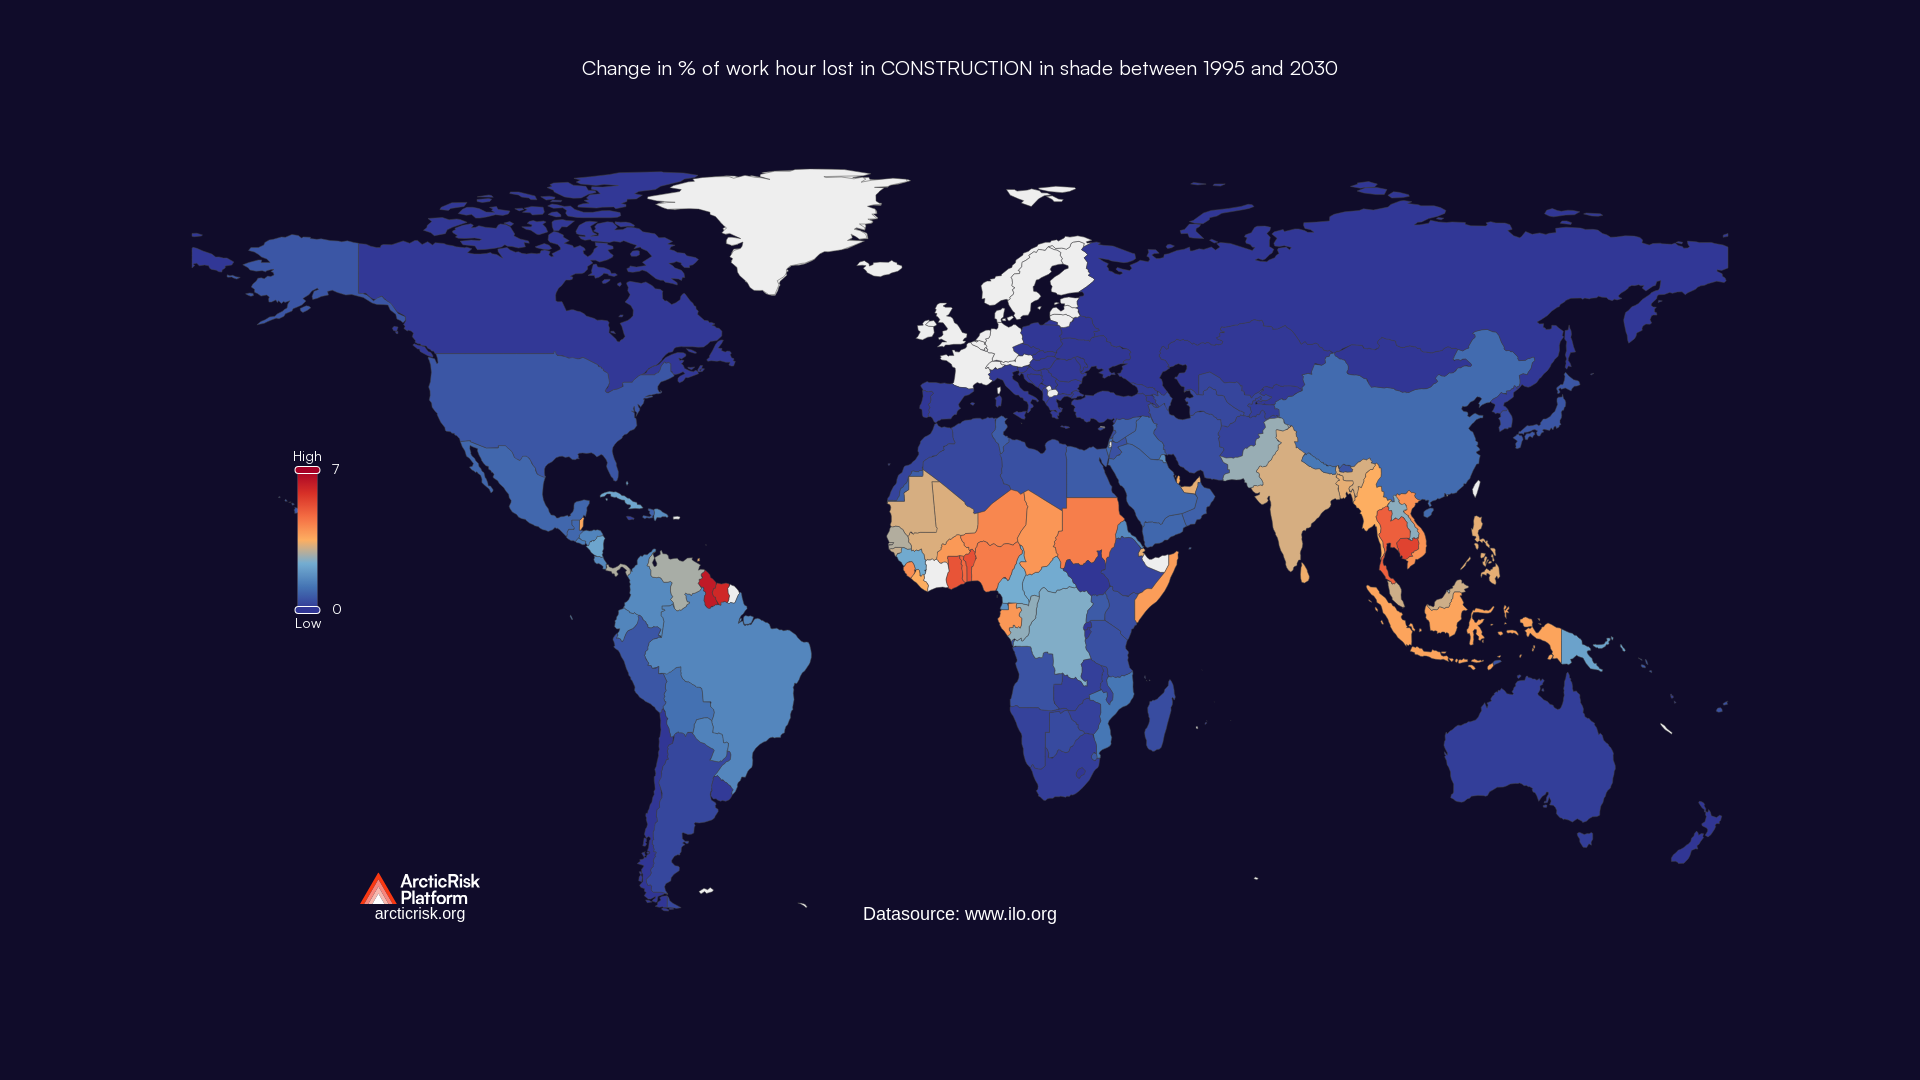
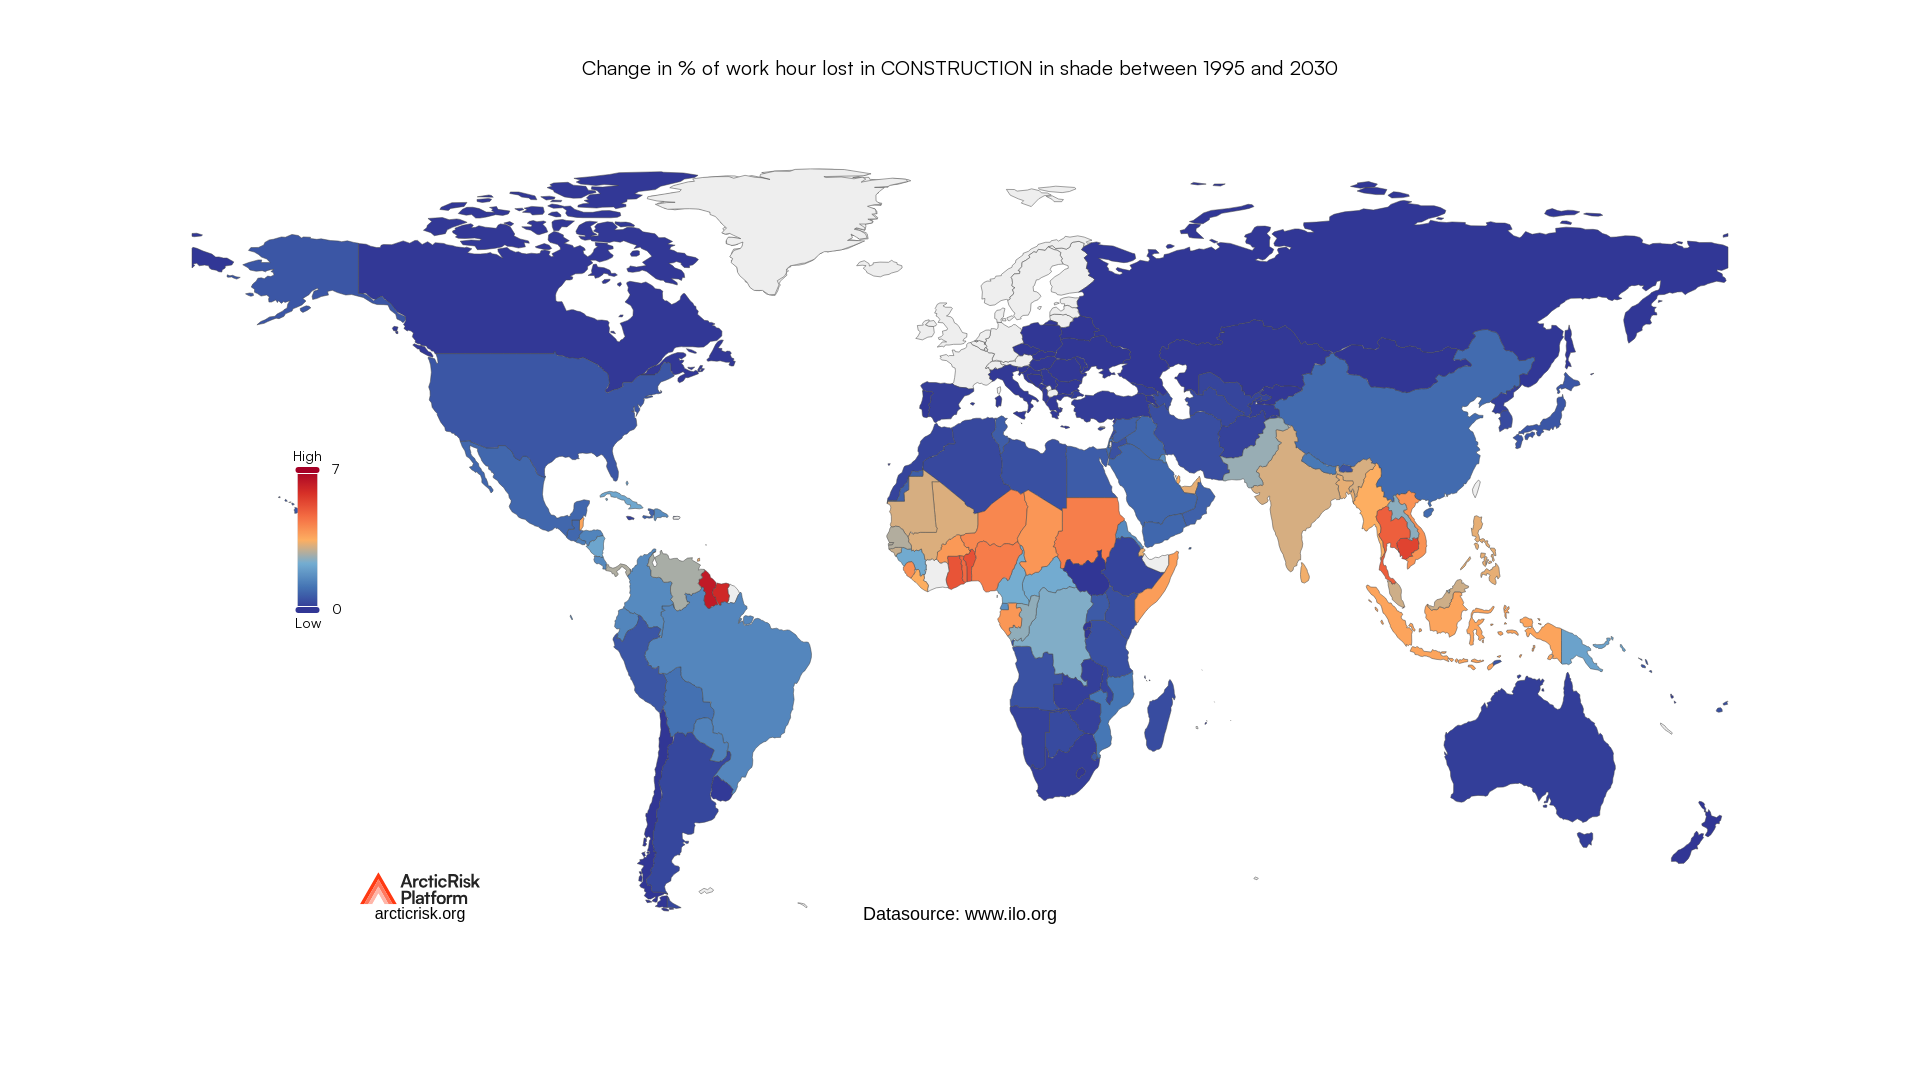
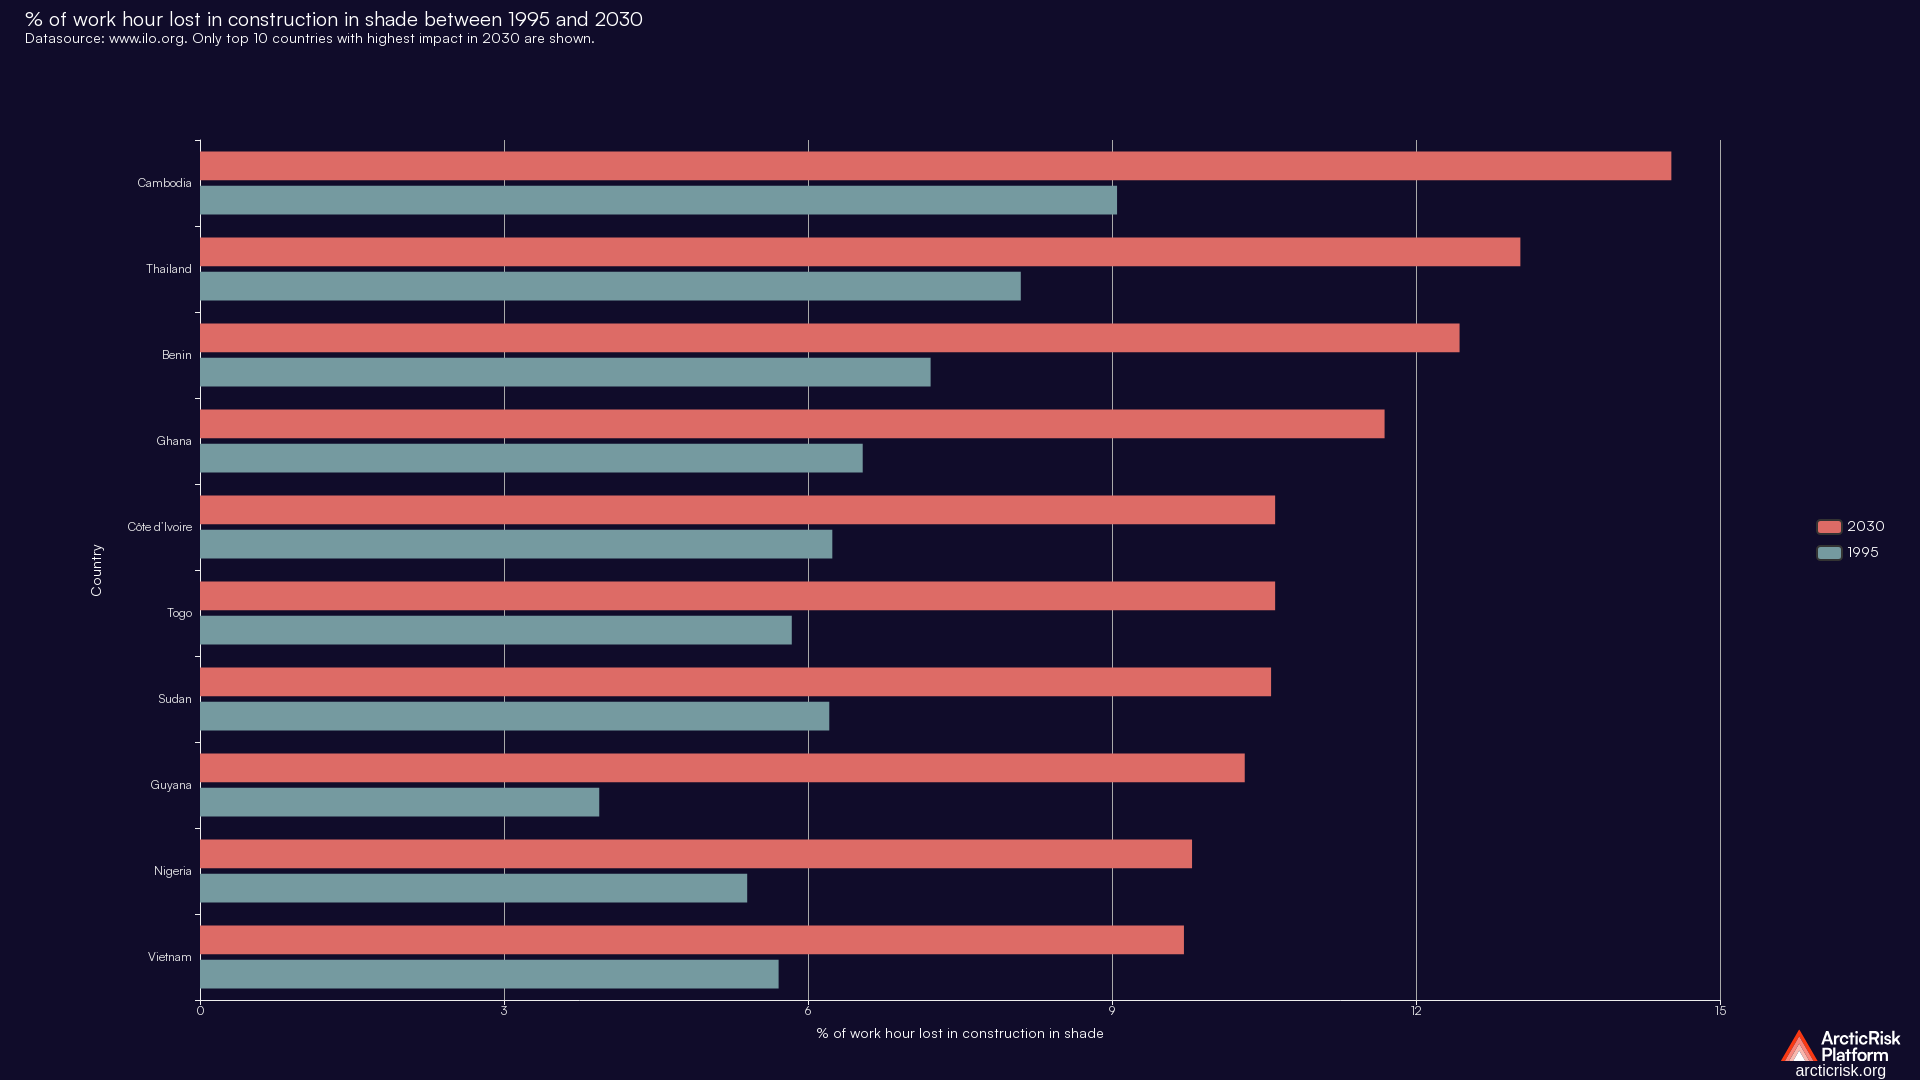
This dataset shwos the extent to which heat stress affects labour productivity, measured in terms of working hours, in virtually every cou…

This dataset shwos the extent to which heat stress affects labour productivity, measured in terms of working hours, in virtually every cou…


This dataset shwos the extent to which heat stress affects labour productivity, measured in terms of working hours, in virtually every cou…
This dataset shwos the extent to which heat stress affects labour productivity, measured in terms of working hours, in virtually every cou…
This dataset shwos the extent to which heat stress affects labour productivity, measured in terms of working hours, in virtually every cou…
This dataset shwos the extent to which heat stress affects labour productivity, measured in terms of working hours, in virtually every cou…
This dataset shwos the extent to which heat stress affects labour productivity, measured in terms of working hours, in virtually every cou…
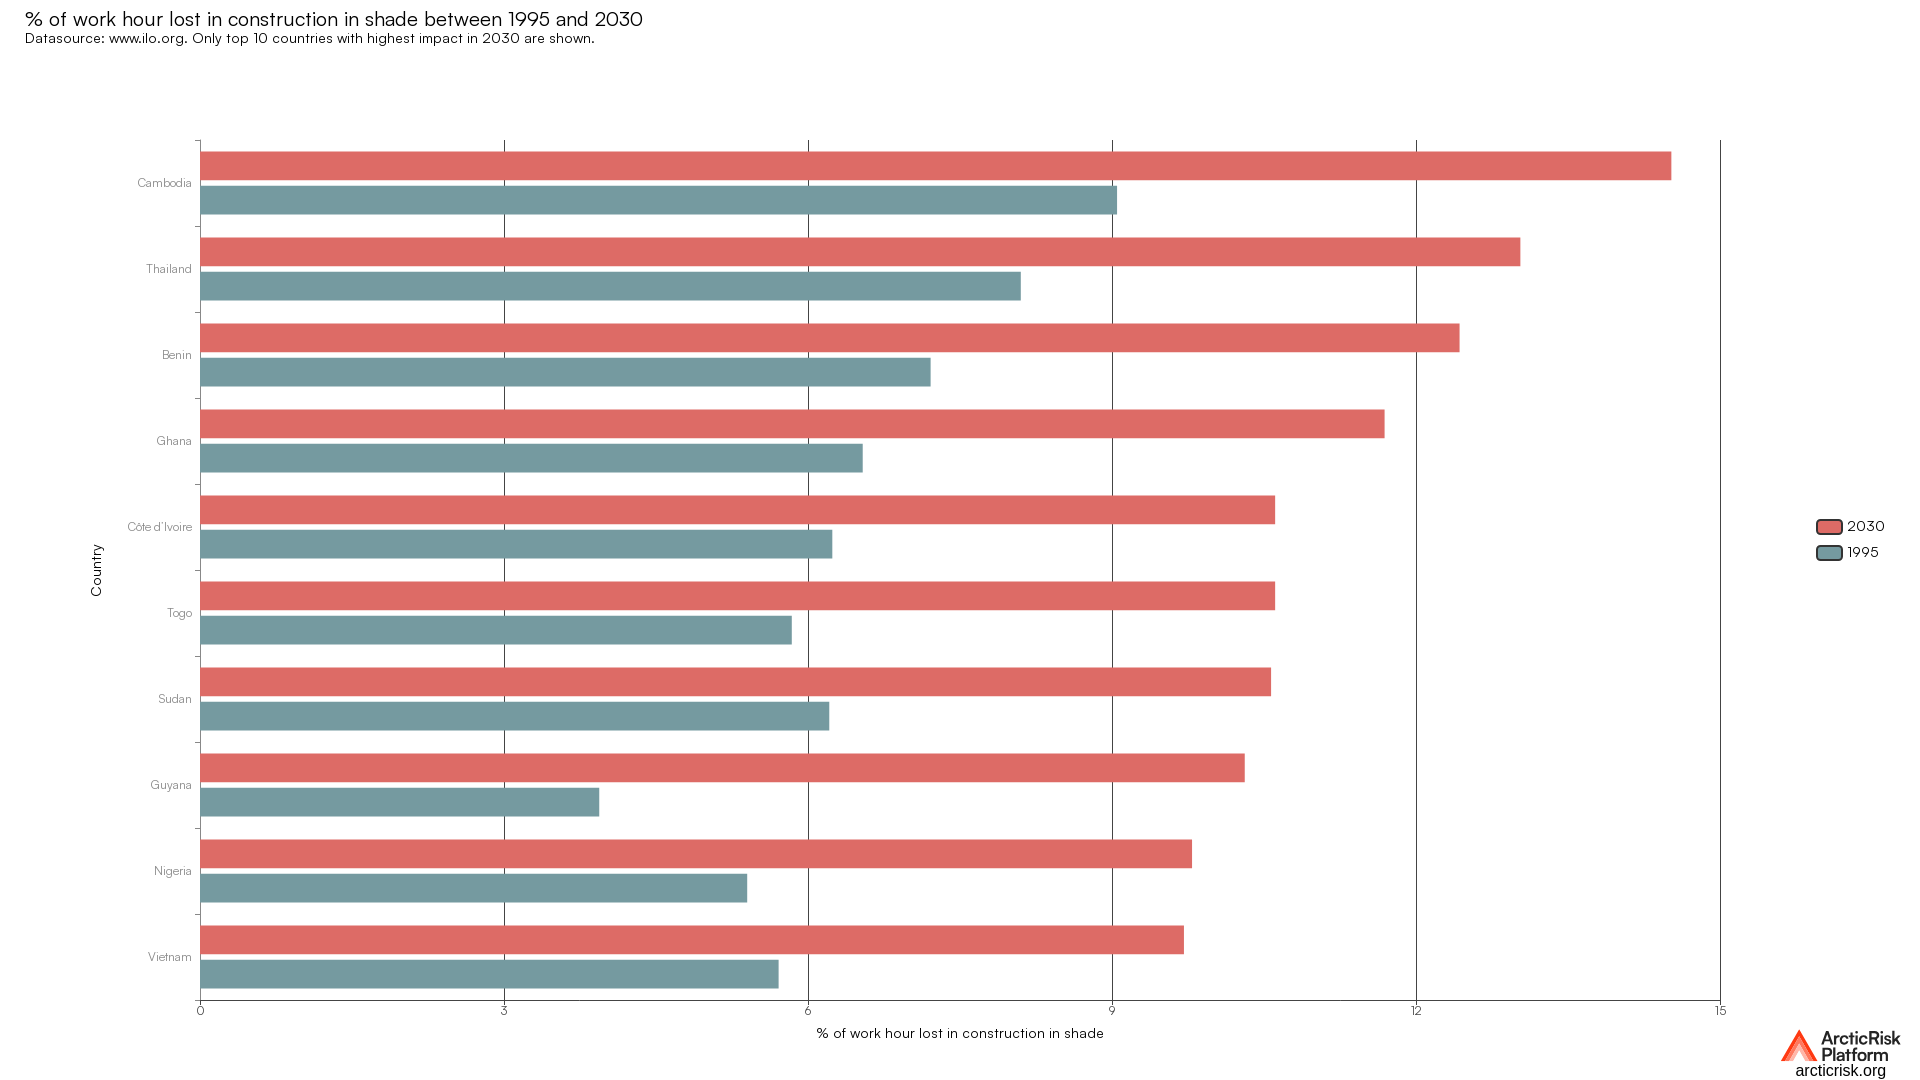
This dataset shwos the extent to which heat stress affects labour productivity, measured in terms of working hours, in virtually every cou…
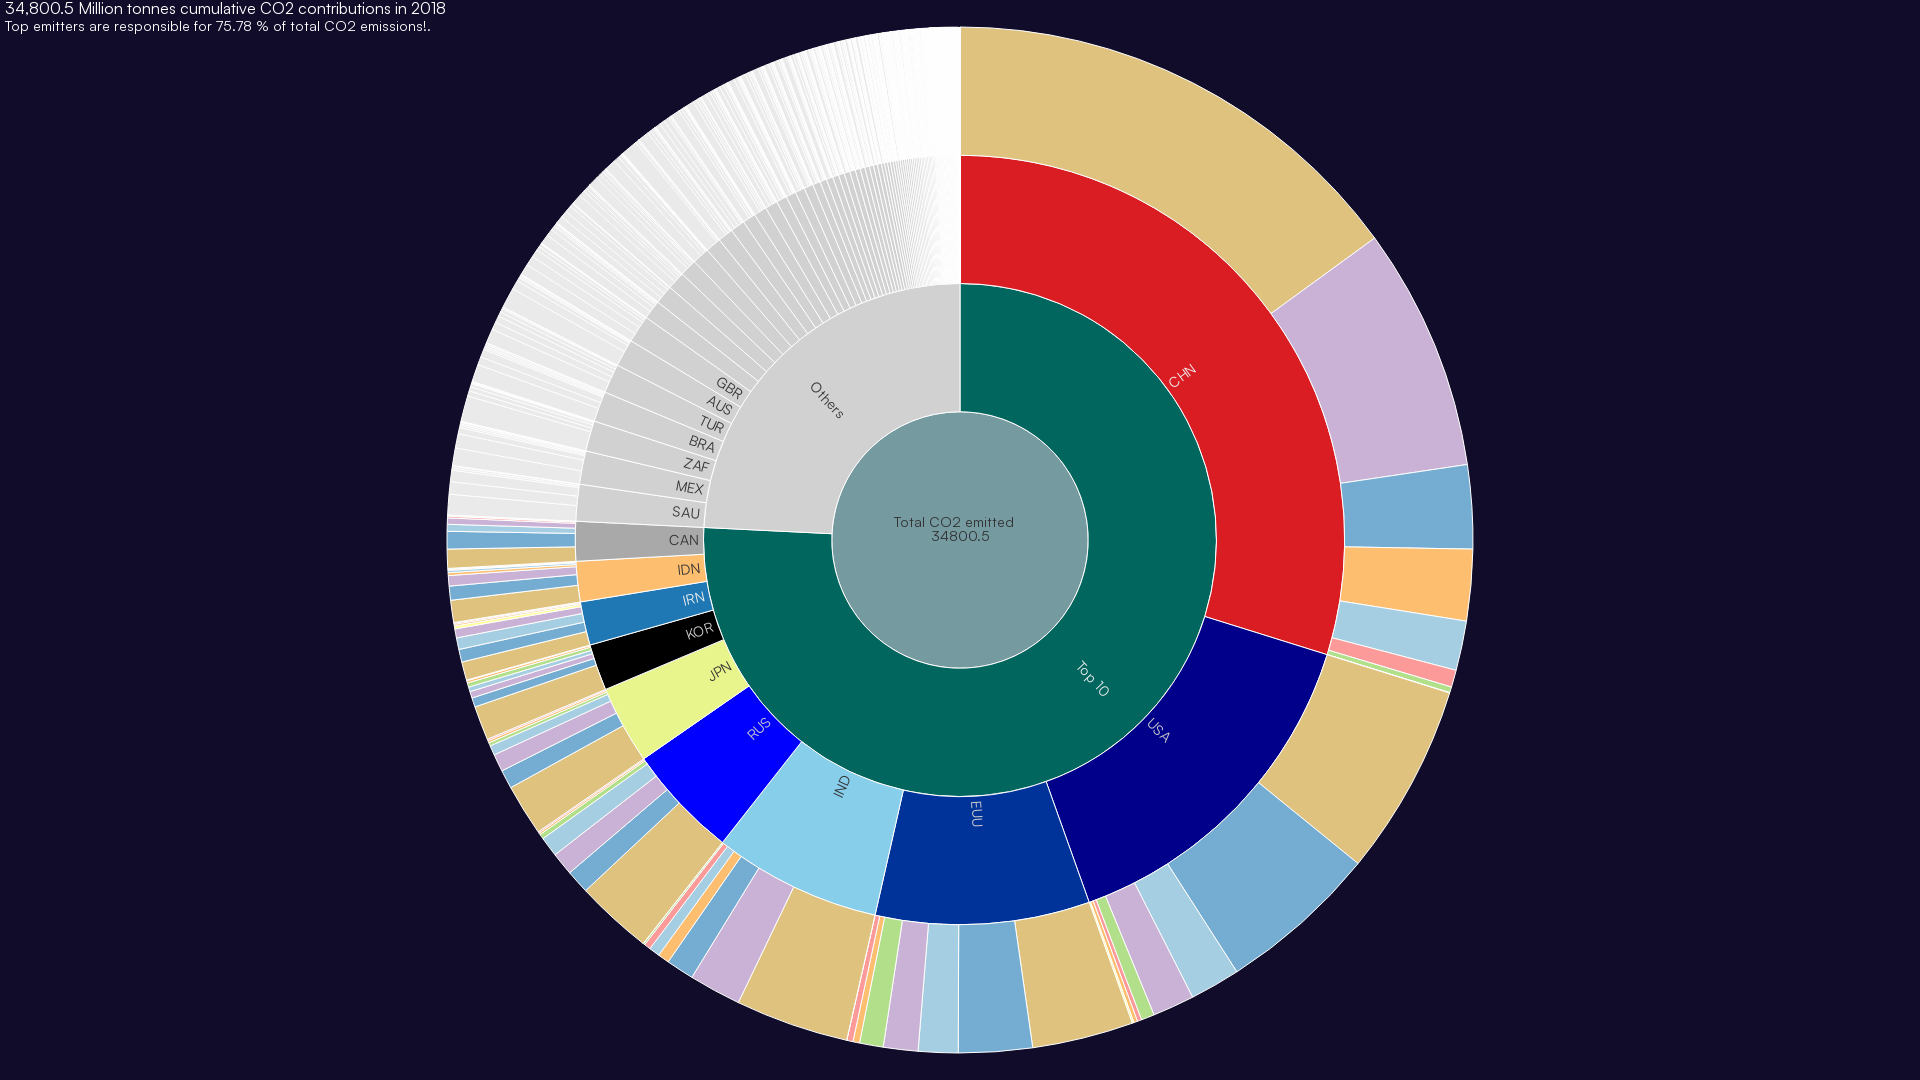
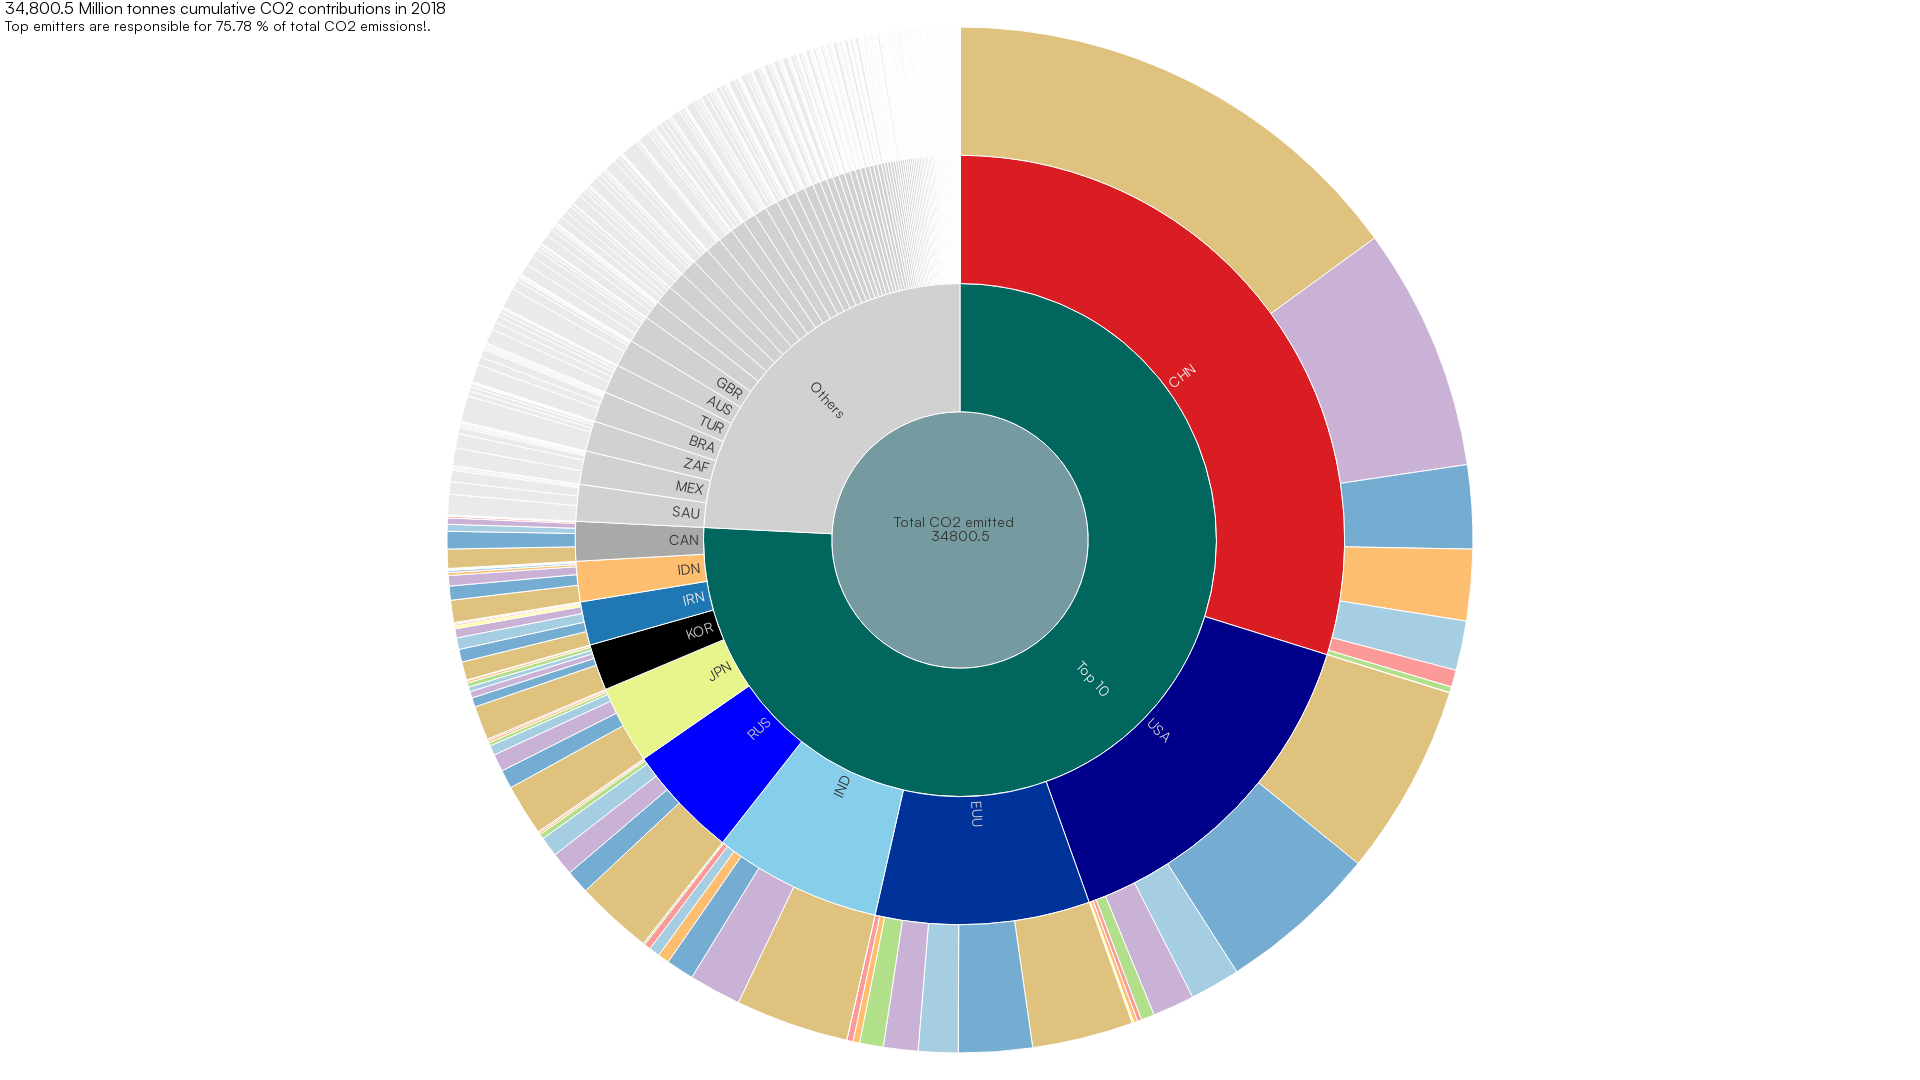
Annual CO₂ emissions data by country, industry sectors and fuel type. Data is only from two main sources CAIT and GCP (Global Carbon projec…


Annual CO₂ emissions data by country, industry sectors and fuel type. Data is only from two main sources CAIT and GCP (Global Carbon projec…


Annual CO₂ emissions data by country, industry sectors and fuel type. Data is only from two main sources CAIT and GCP (Global Carbon projec…


Annual CO₂ emissions data by country, industry sectors and fuel type. Data is only from two main sources CAIT and GCP (Global Carbon projec…