FREEZE: Climate Data Explorer
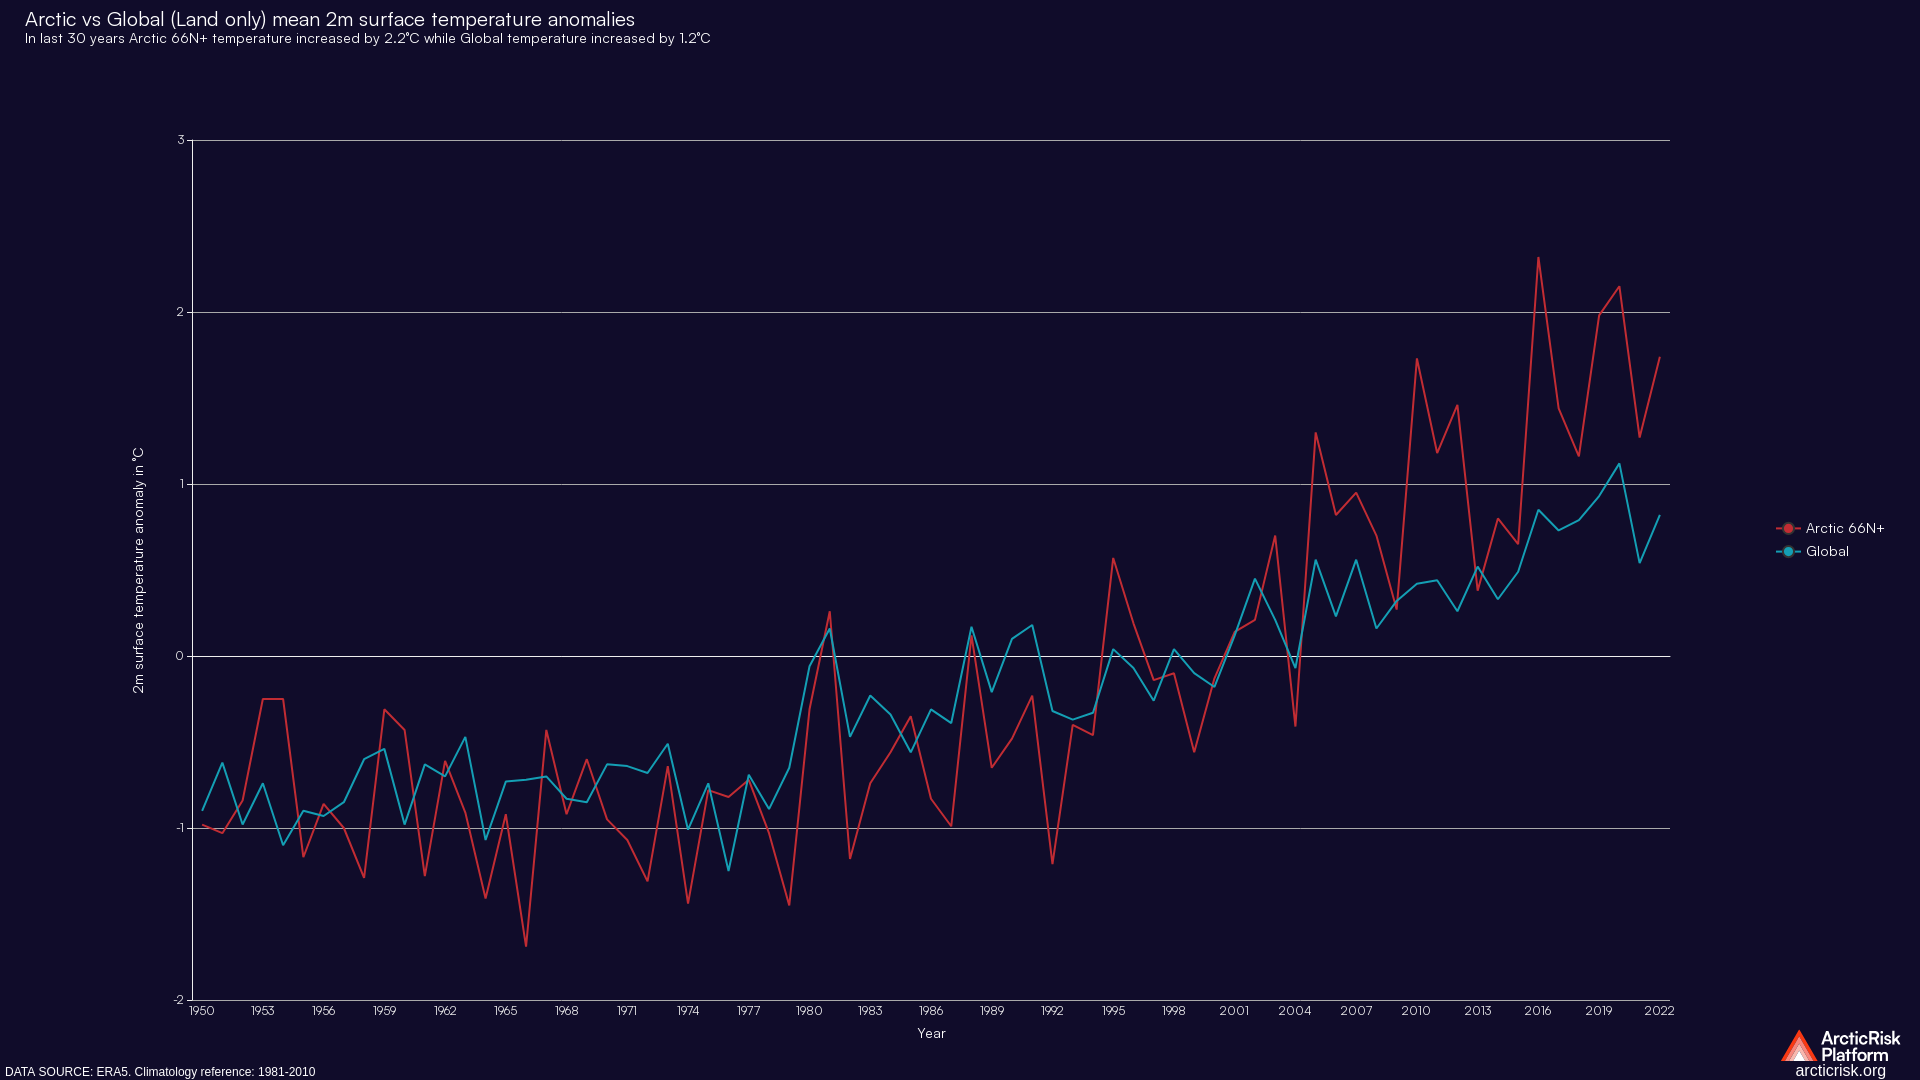
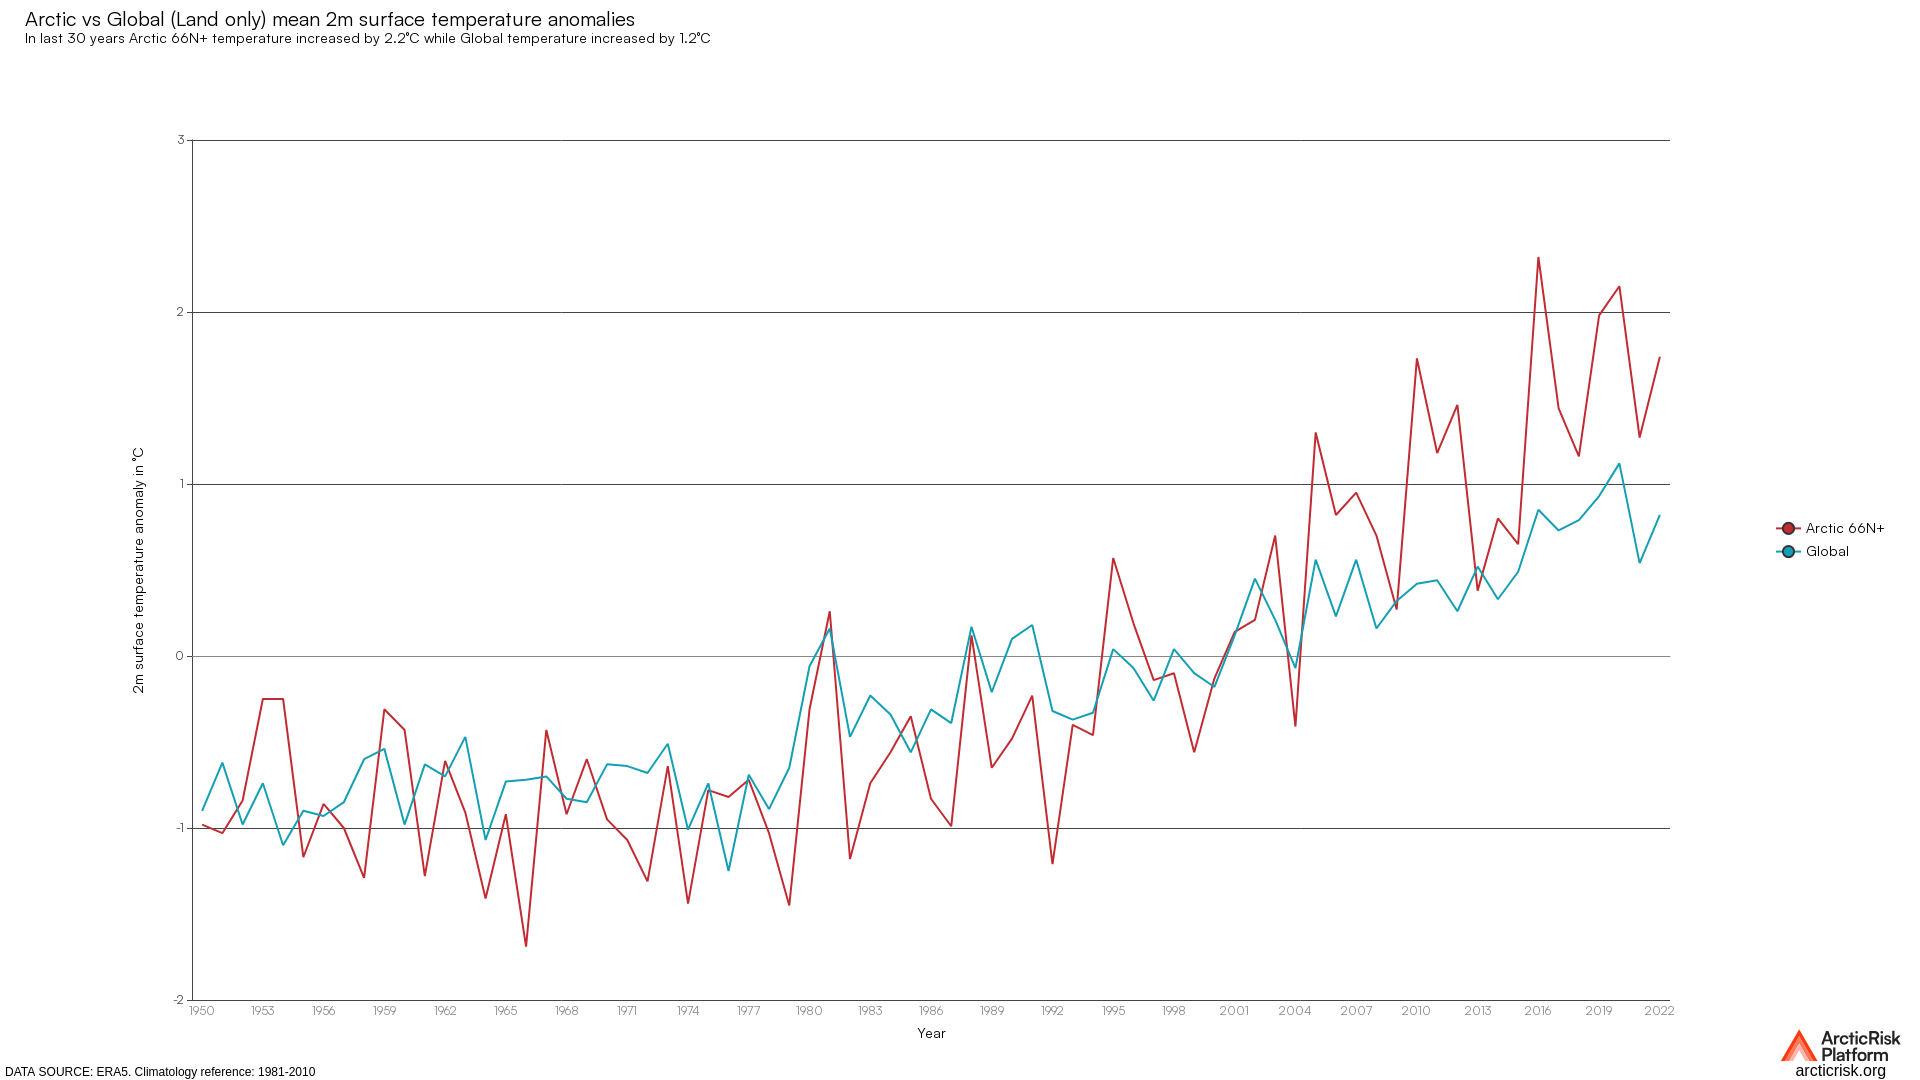
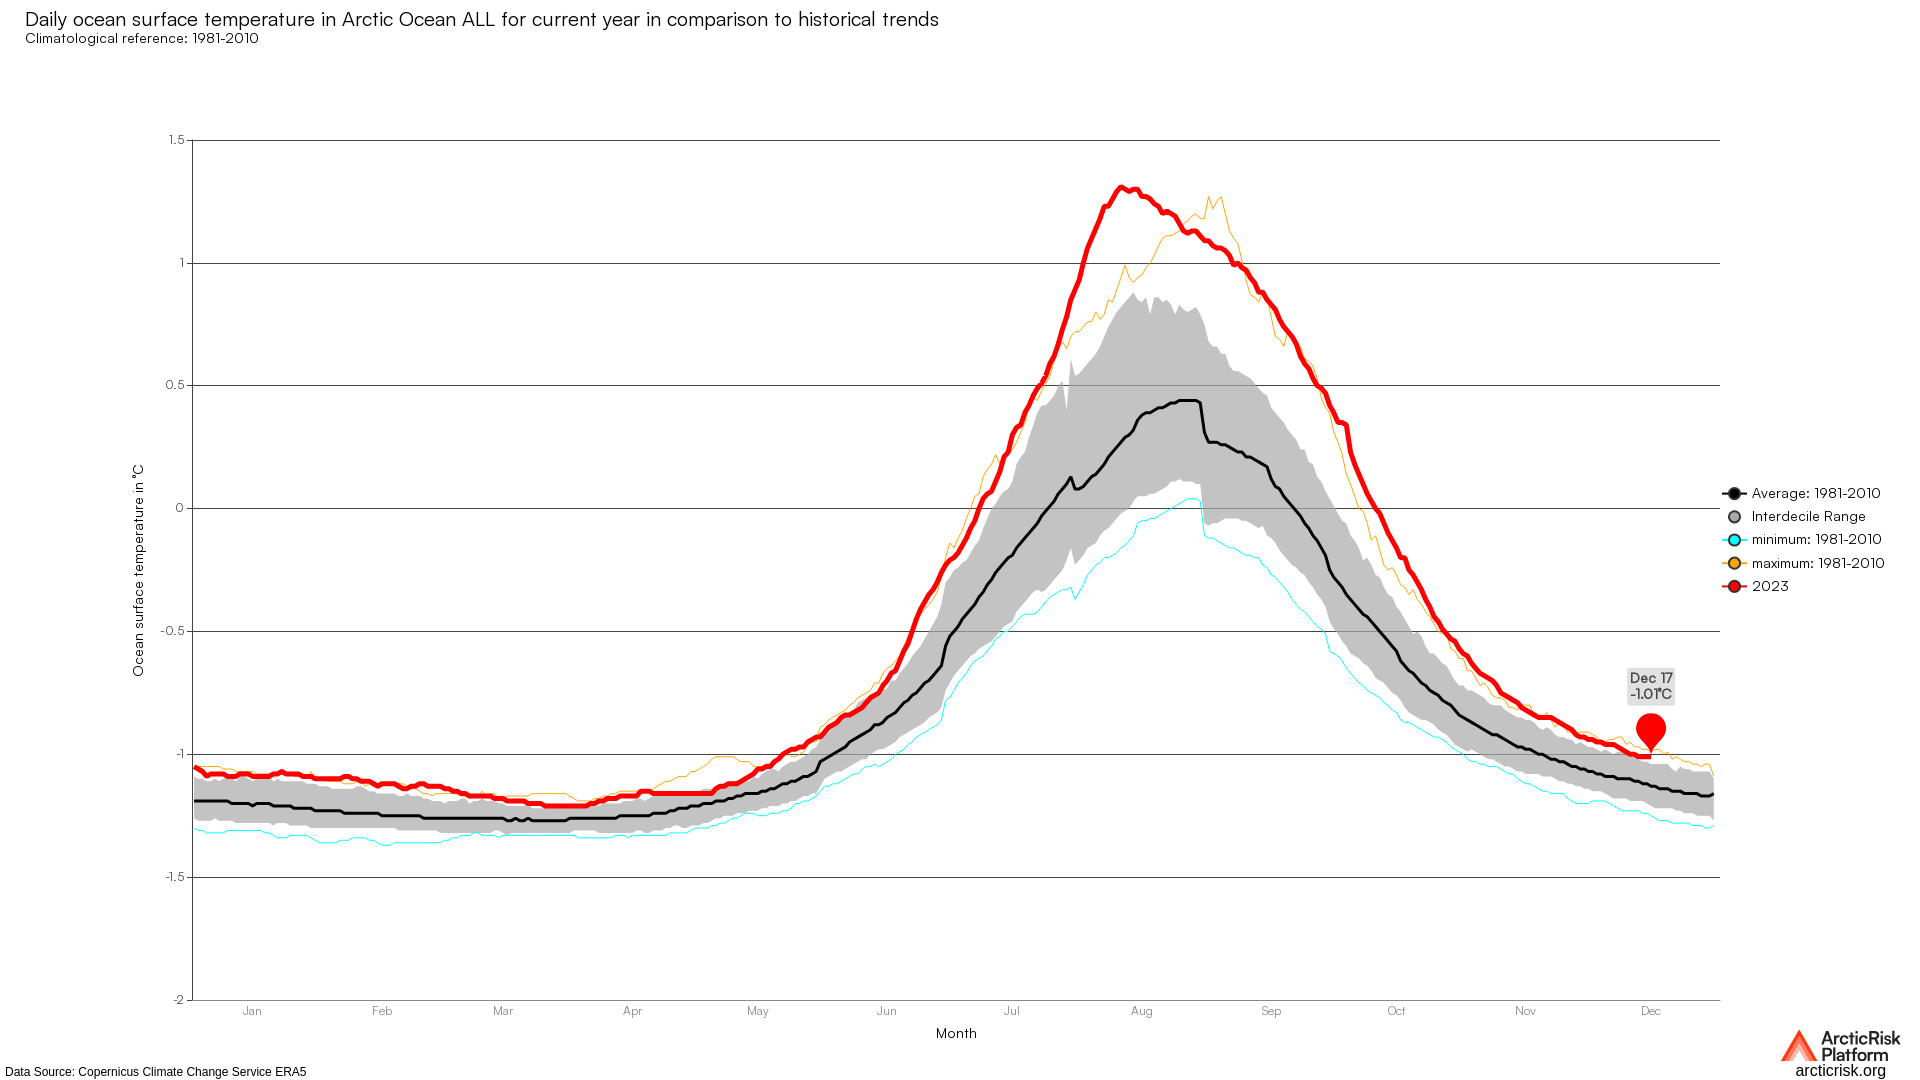
Daily land only 2m surface temperature across various latitudnal zones over the years.Derived from dataset made available by ECMWF; Dataset…
Daily of 2m surface temperature across various latitudnal zones over the years.Derived from dataset made available by ECMWF; Dataset :Daily…


Daily of 2m surface temperature across various latitudnal zones over the years.Derived from dataset made available by ECMWF; Dataset :Daily…
Daily of 2m surface temperature across various latitudnal zones over the years.Derived from dataset made available by ECMWF; Dataset :Daily…

Daily land only 2m surface temperature across various latitudnal zones over the years.Derived from dataset made available by ECMWF; Dataset…
Daily of 2m surface temperature across various latitudnal zones over the years.Derived from dataset made available by ECMWF; Dataset :Daily…

Daily of 2m surface temperature across various latitudnal zones over the years.Derived from dataset made available by ECMWF; Dataset :Daily…


Daily of 2m surface temperature across various latitudnal zones over the years.Derived from dataset made available by ECMWF; Dataset :Daily…


Daily of 2m surface temperature across various latitudnal zones over the years.Derived from dataset made available by ECMWF; Dataset :Daily…

Daily of 2m surface temperature across various latitudnal zones over the years.Derived from dataset made available by ECMWF; Dataset :Daily…

Daily of 2m surface temperature across various latitudnal zones over the years.Derived from dataset made available by ECMWF; Dataset :Daily…

