
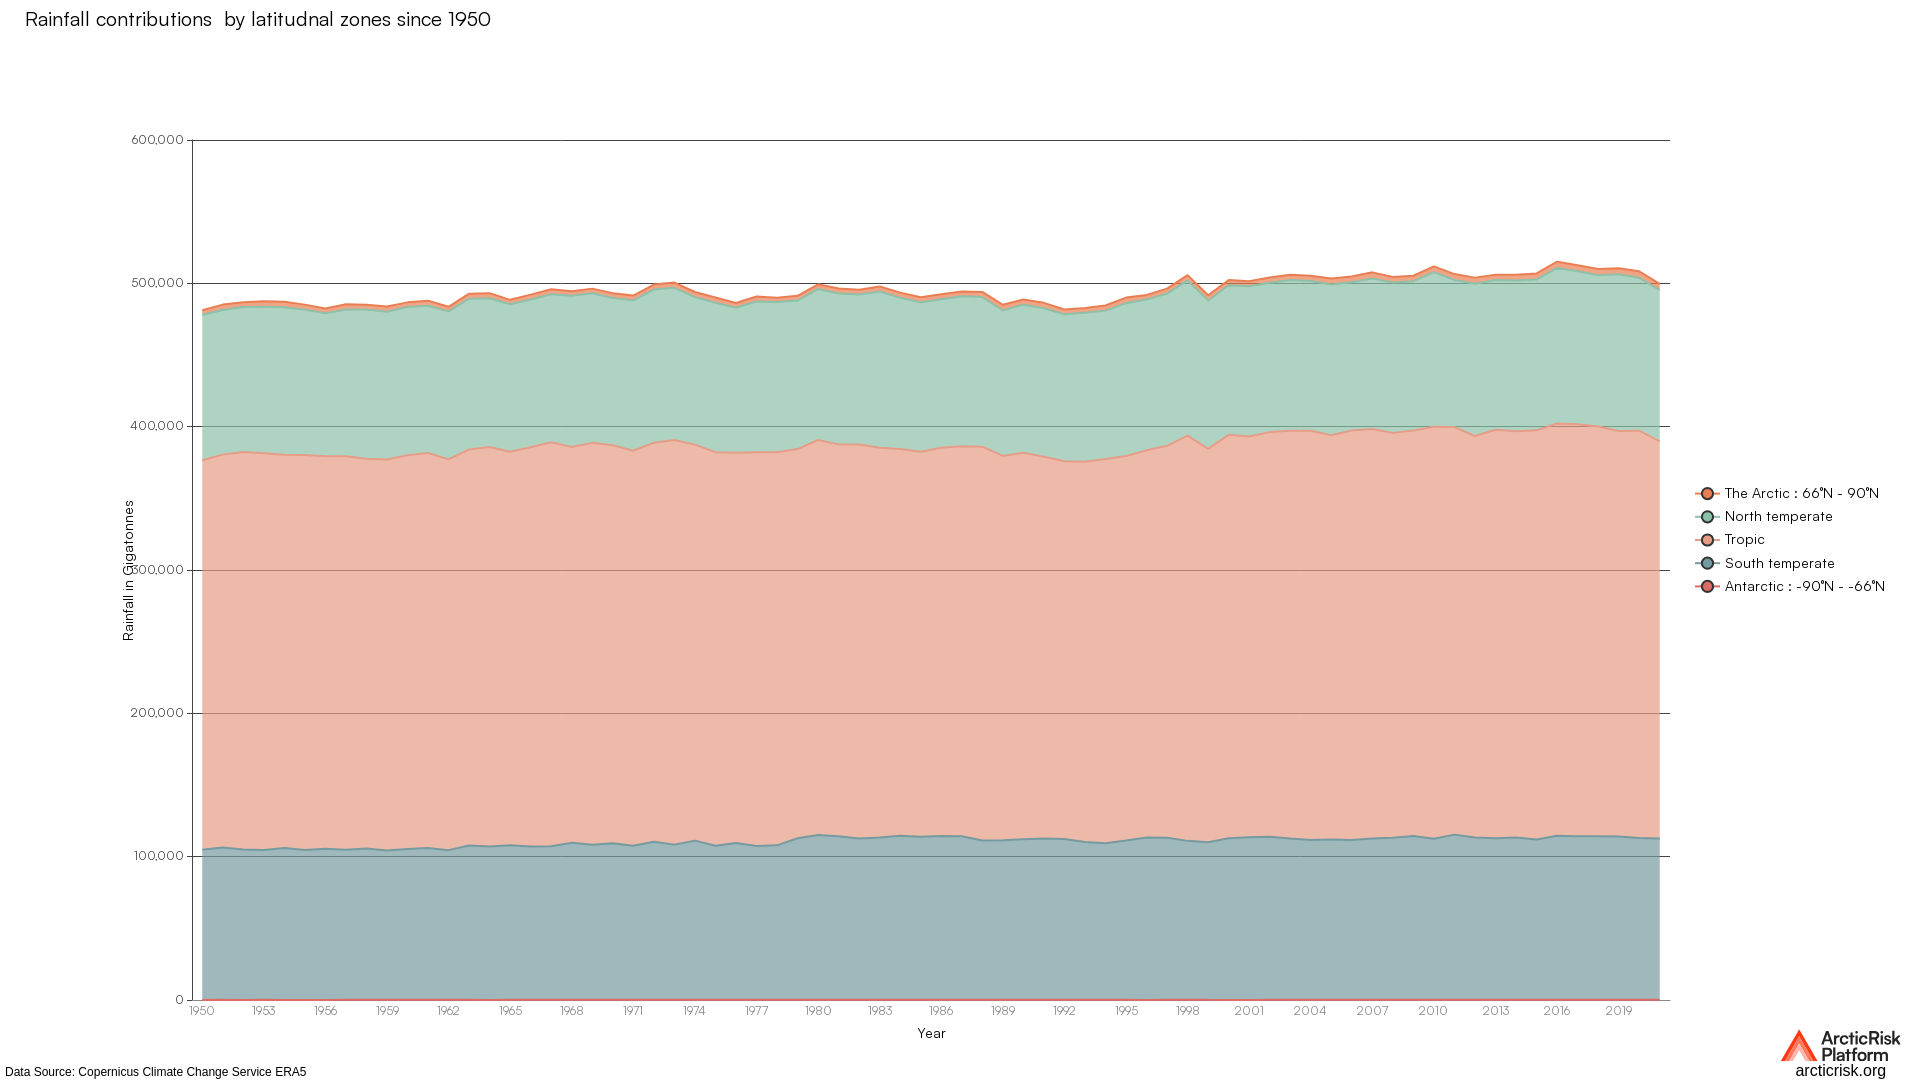
Daily rainfall precipitation by latitudnal zones in giga tonnes and liquid water equivalent in metres over the years.Derived from dataset m…


Daily snowfall precipitation by latitudnal zones in giga tonnes and liquid water equivalent in metres over the years.Derived from dataset m…
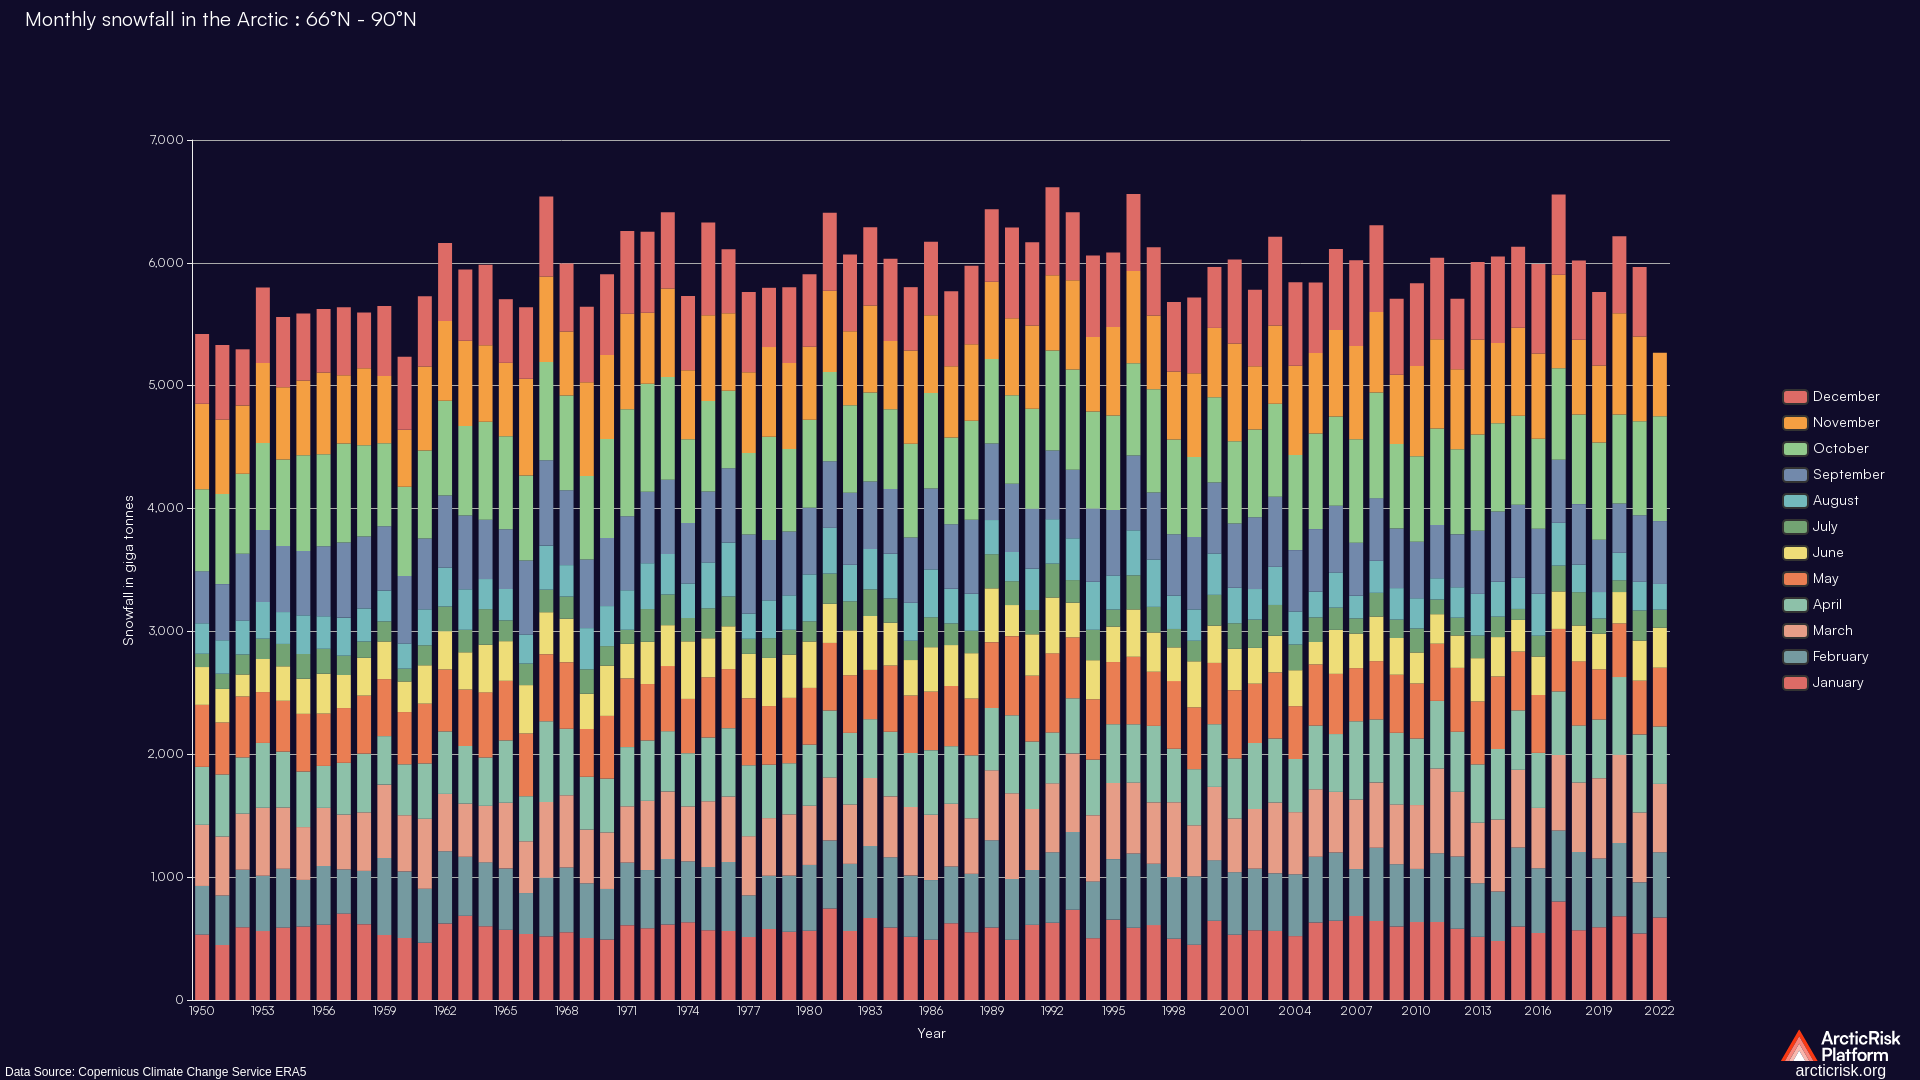

Daily snowfall precipitation by latitudnal zones in giga tonnes and liquid water equivalent in metres over the years.Derived from dataset m…


Daily snowfall precipitation by latitudnal zones in giga tonnes and liquid water equivalent in metres over the years.Derived from dataset m…
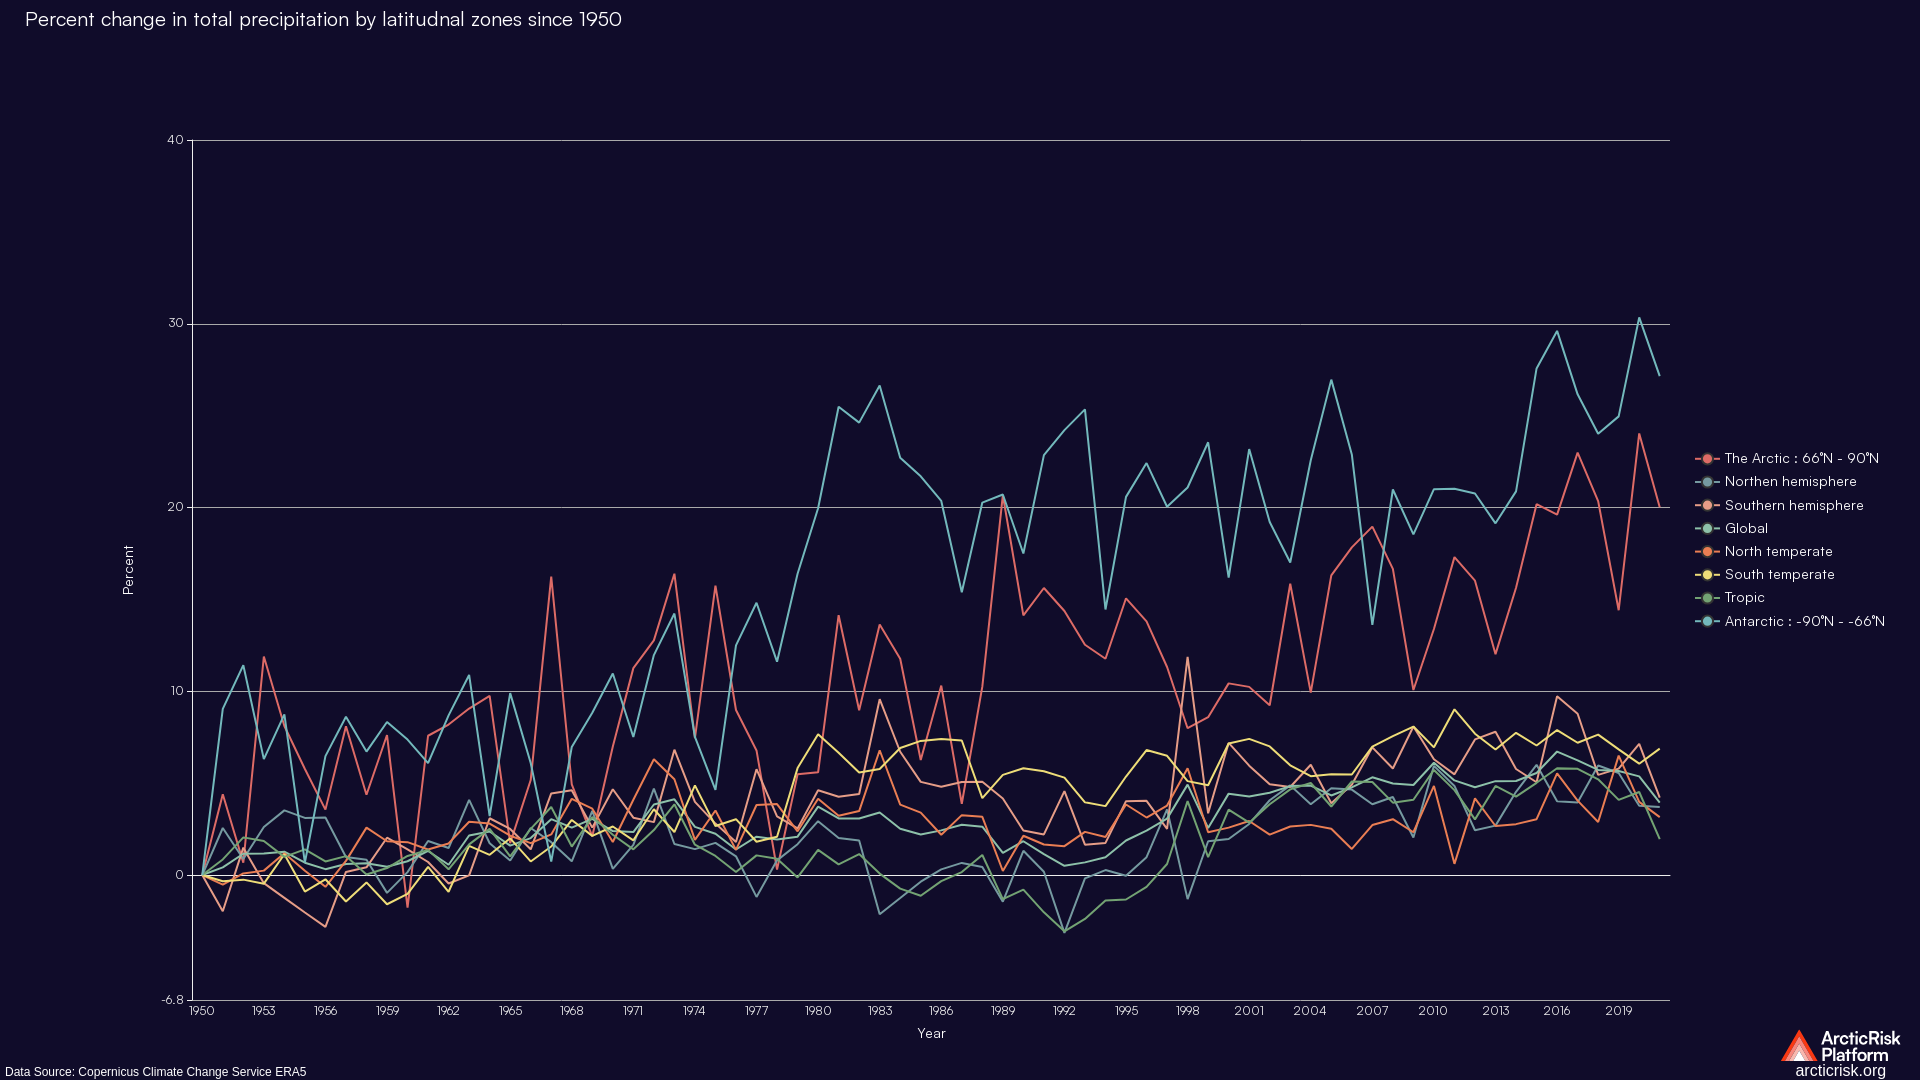
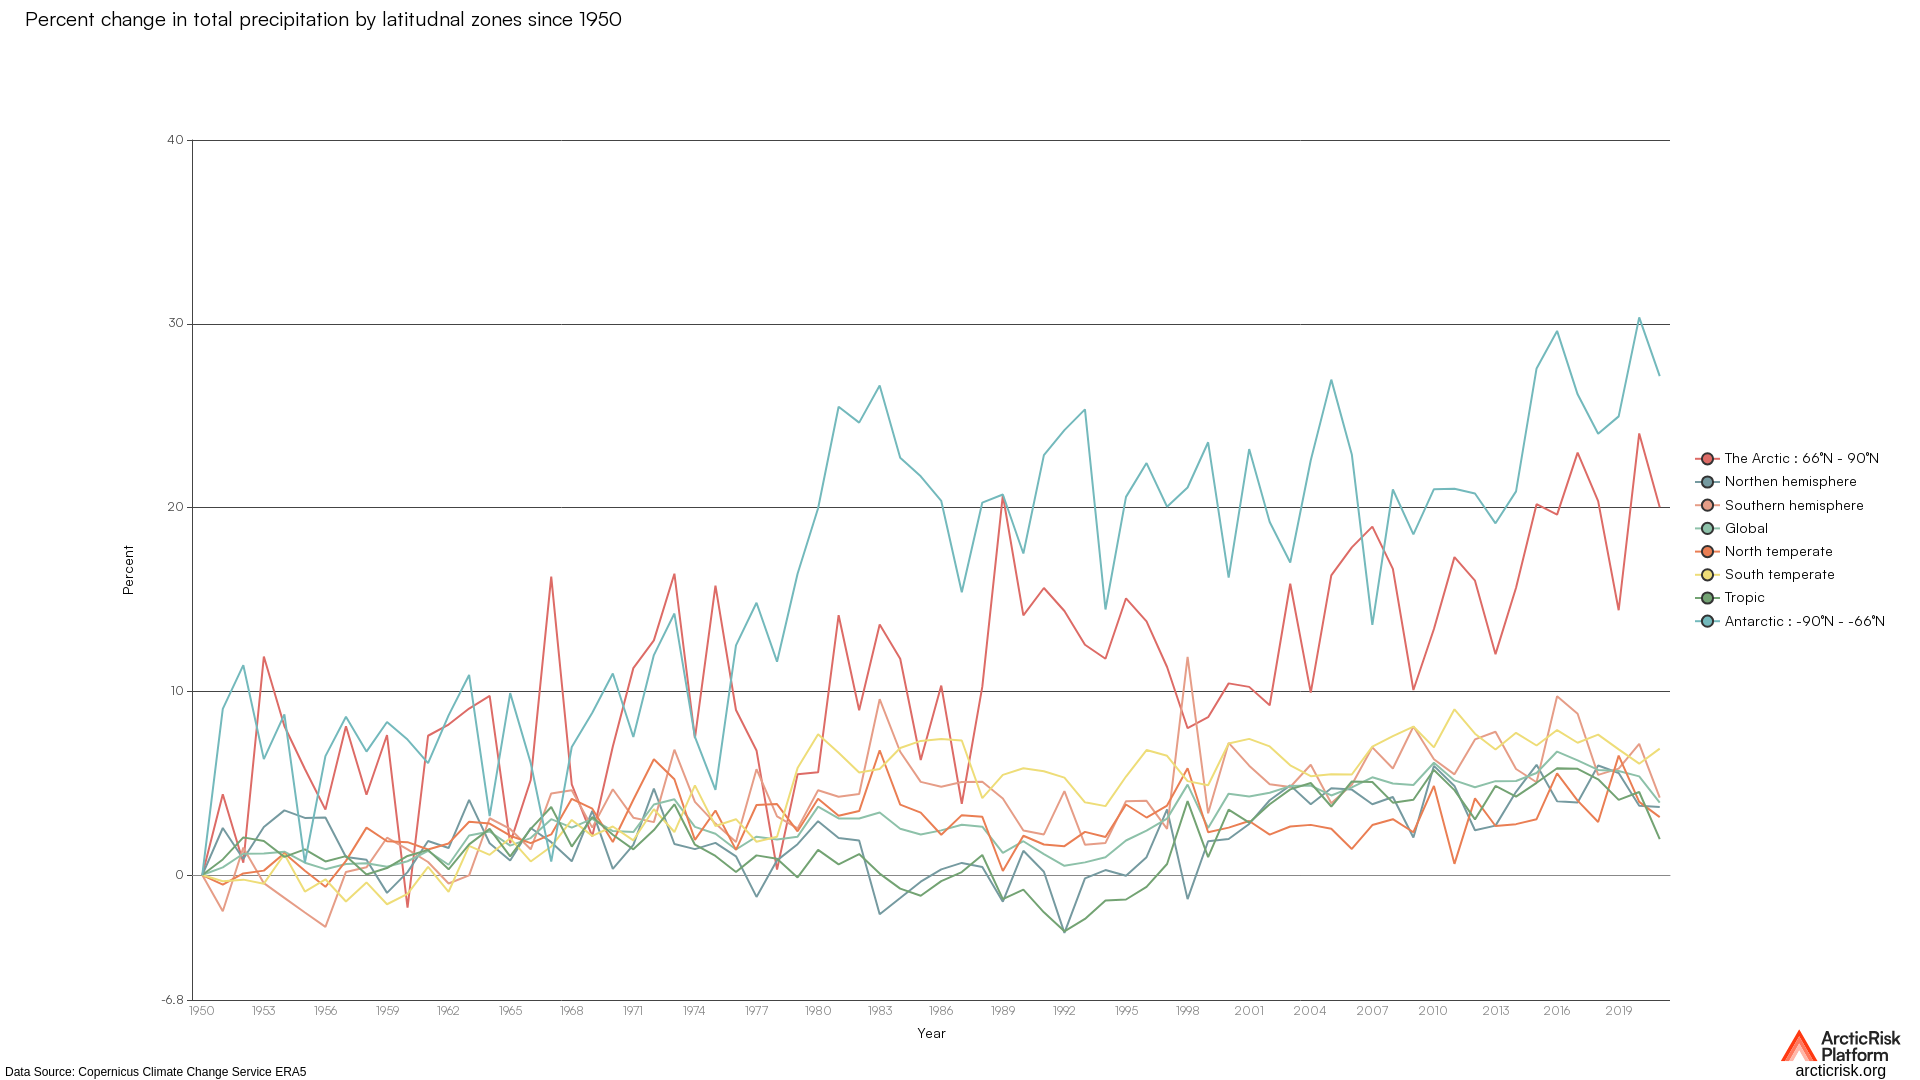
Daily total precipitation by latitudnal zones in giga tonnes and liquid water equivalent in metres over the years.Derived from dataset made…


Daily total precipitation by latitudnal zones in giga tonnes and liquid water equivalent in metres over the years.Derived from dataset made…


Daily total precipitation by latitudnal zones in giga tonnes and liquid water equivalent in metres over the years.Derived from dataset made…
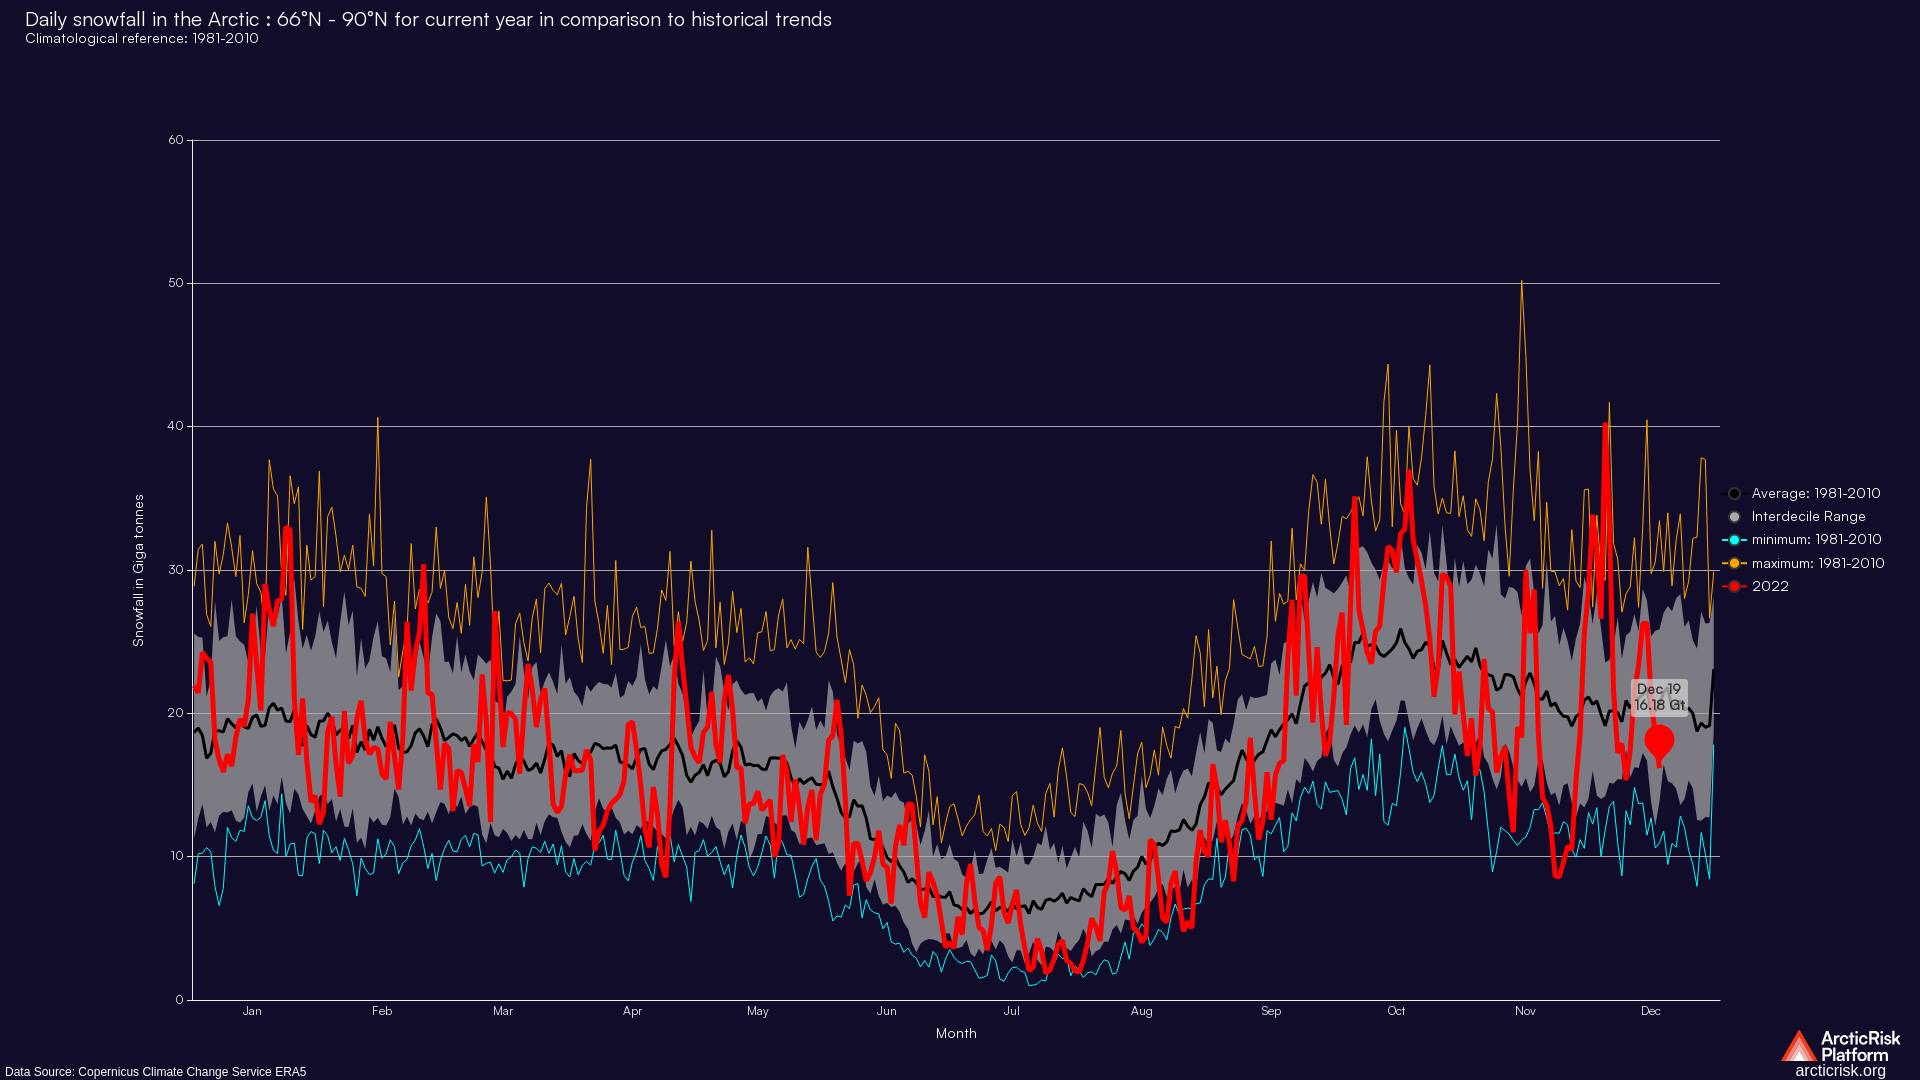

Daily snowfall precipitation by latitudnal zones in giga tonnes and liquid water equivalent in metres over the years.Derived from dataset m…


Daily total precipitation by latitudnal zones in giga tonnes and liquid water equivalent in metres over the years.Derived from dataset made…


Daily total precipitation by latitudnal zones in giga tonnes and liquid water equivalent in metres over the years.Derived from dataset made…