FREEZE: Climate Data Explorer


Daily snowfall precipitation by latitudnal zones in giga tonnes and liquid water equivalent in metres over the years.Derived from dataset m…


Daily total precipitation by latitudnal zones in giga tonnes and liquid water equivalent in metres over the years.Derived from dataset made…


Global mean Sea level rise historical values based on NASA JPL and SSP projections based on CMIP6 model simulations as provided by IPCC. …


Global mean sea level rise trend data in mm. Derived from dataset made available by NASA''s Jet Propulsion Laboratory at PODAAC.


Global mean sea level rise trend data in mm. Derived from dataset made available by NASA''s Jet Propulsion Laboratory at PODAAC.


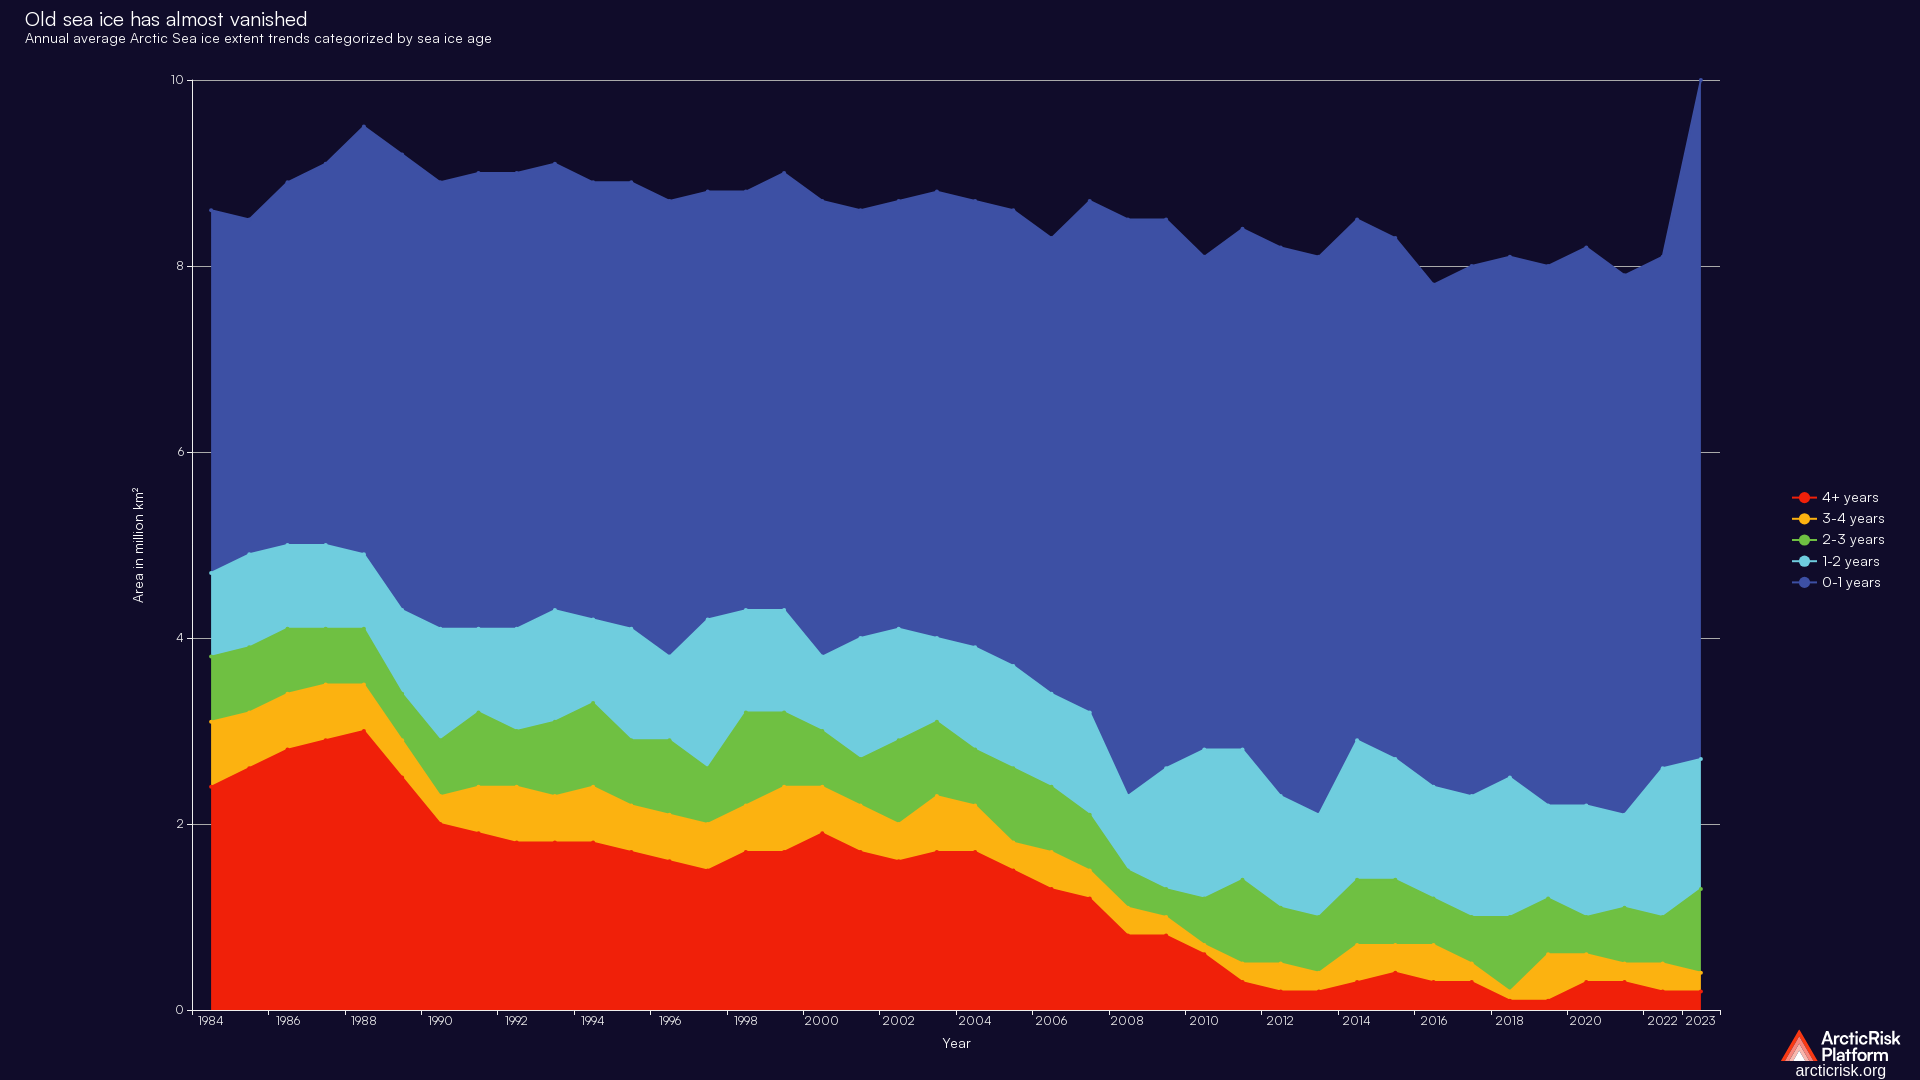
Arctic Sea Ice area in million km2 over the years categorized by its age. Age categories are 0-1, 1-2, 2-3, 3-4 and 4+ years. Derived from …

Arctic Sea Ice area in million km2 over the years categorized by its age. Age categories are 0-1, 1-2, 2-3, 3-4 and 4+ years. Derived from …


September Arctic sea ice area in 10^6 km^2 based on CMIP6 model simulations along with satellite observations by NSIDC. Very likely ranges …


