FREEZE: Climate Data Explorer
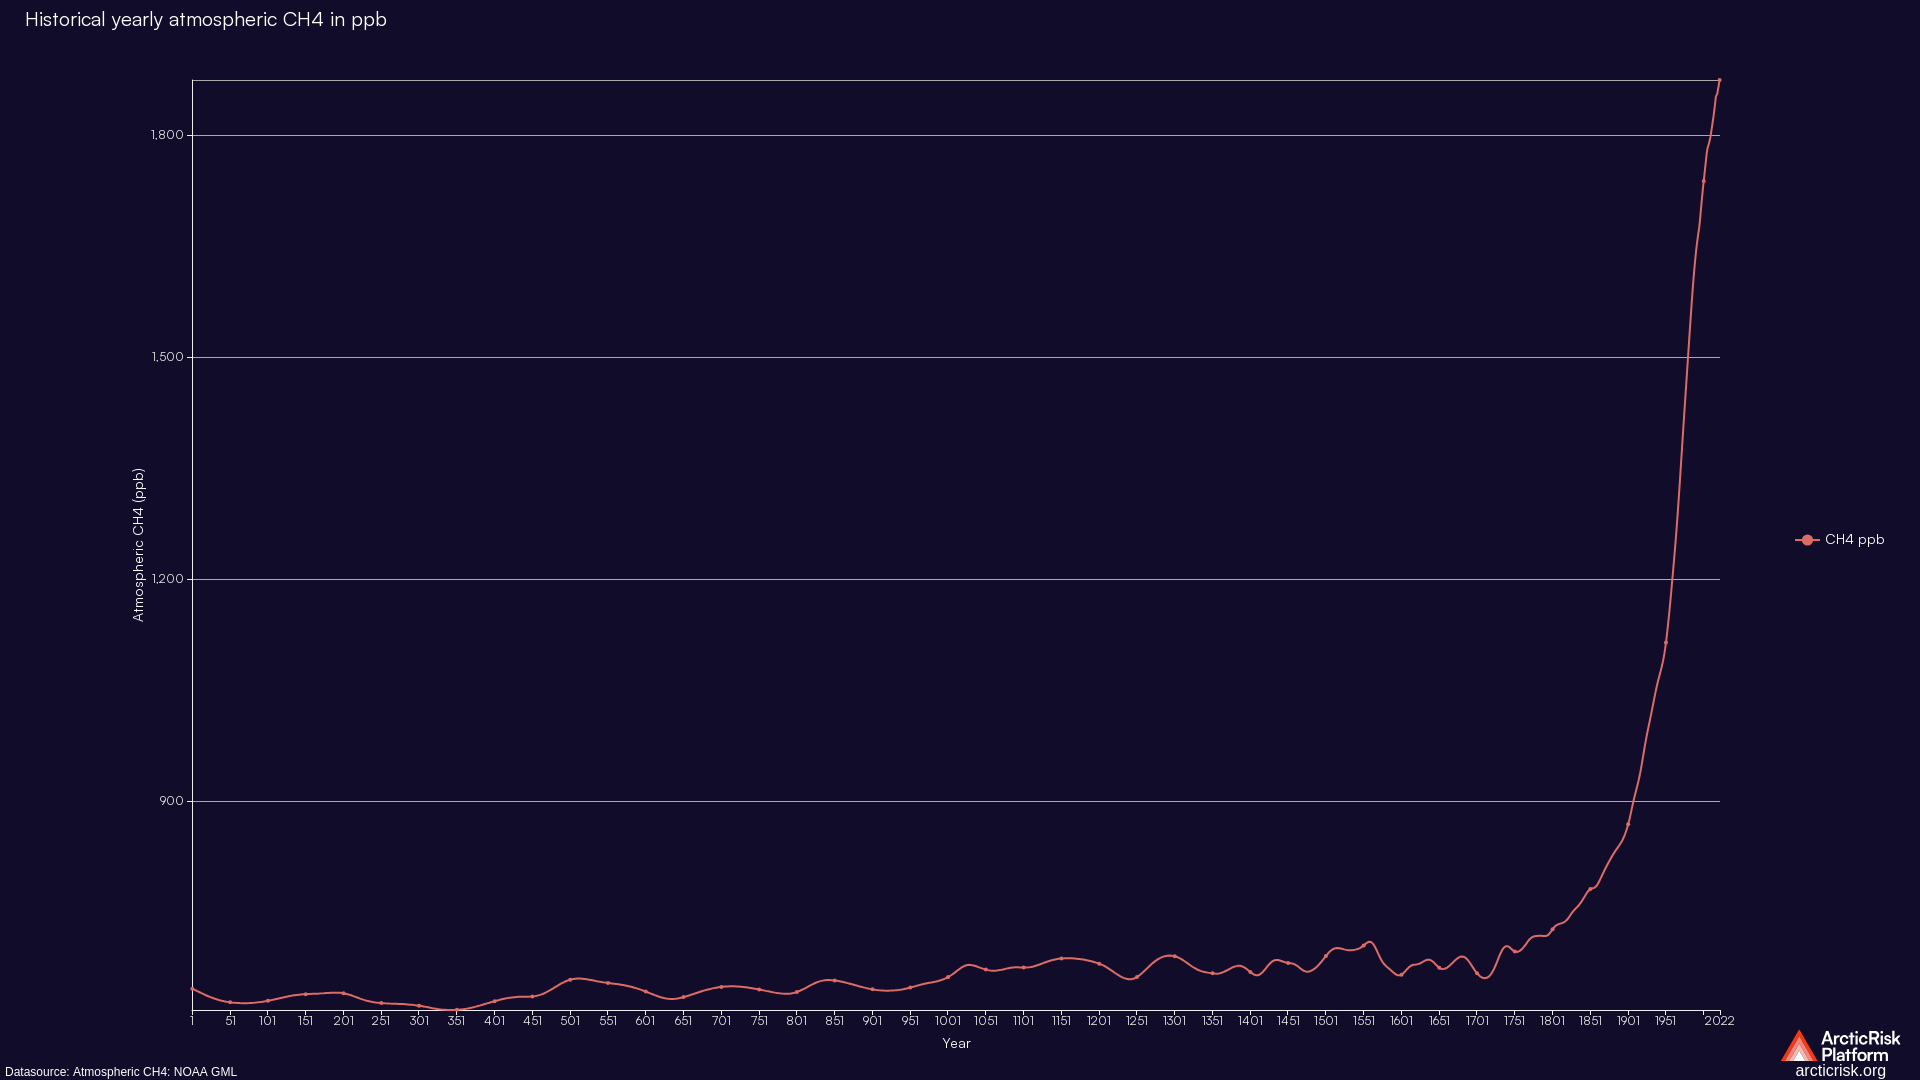
Monthly trends in Atmospheric Methane. Derived from datasource available at NOAA Global Monitoring Laboratory.
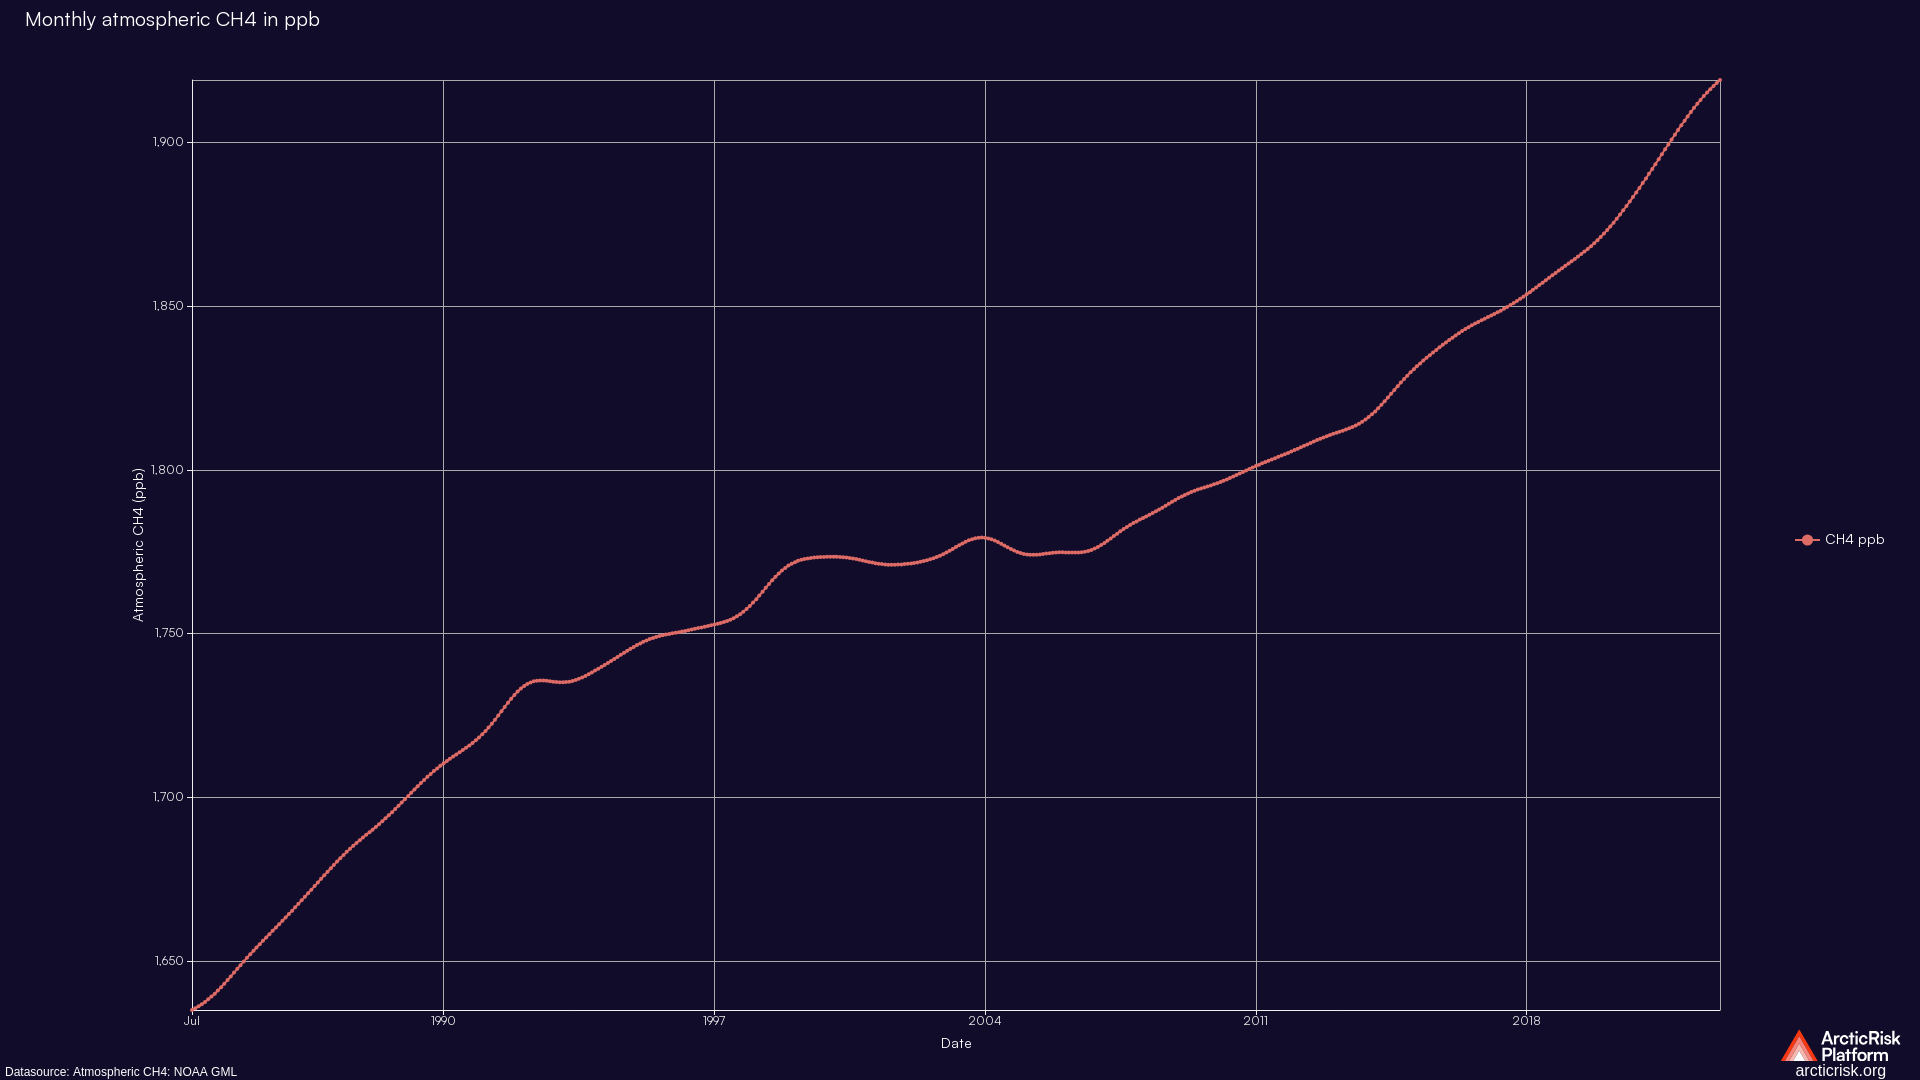
Monthly trends in Atmospheric Methane. Derived from datasource available at NOAA Global Monitoring Laboratory.
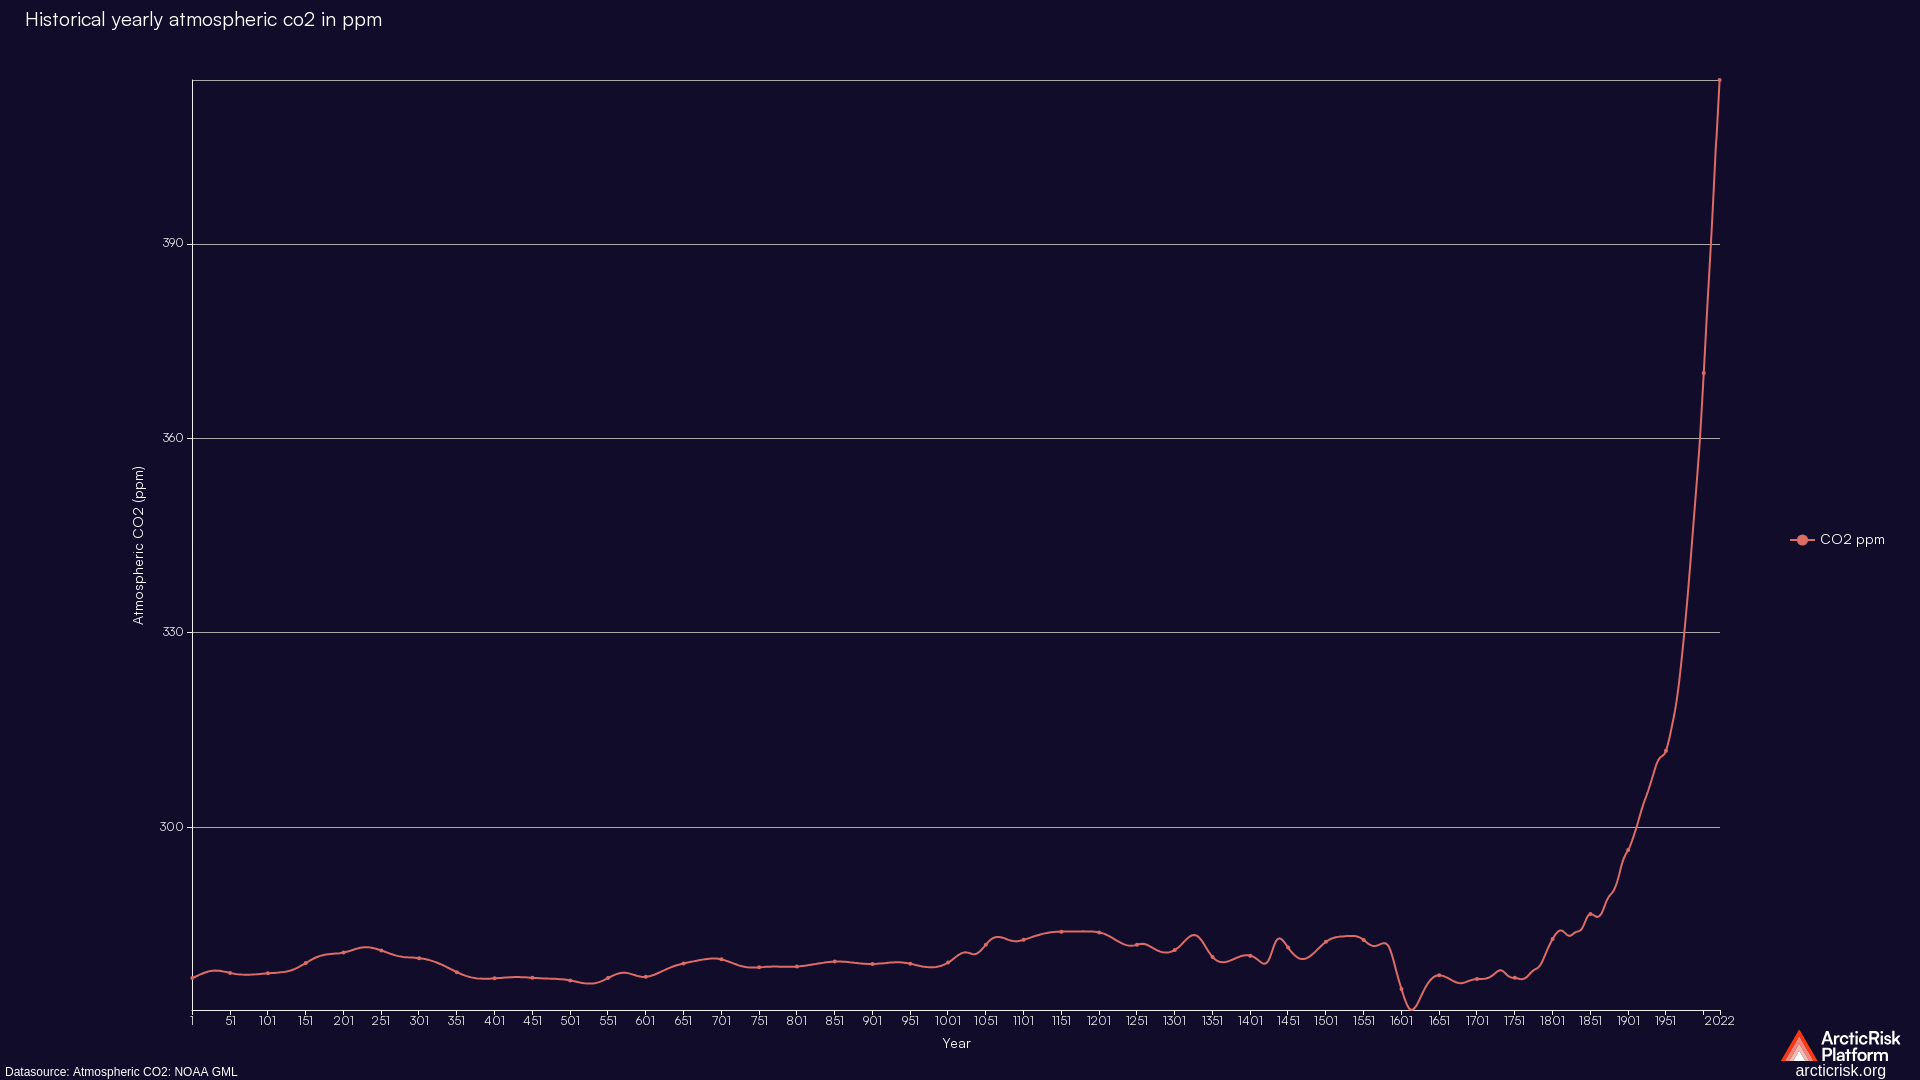
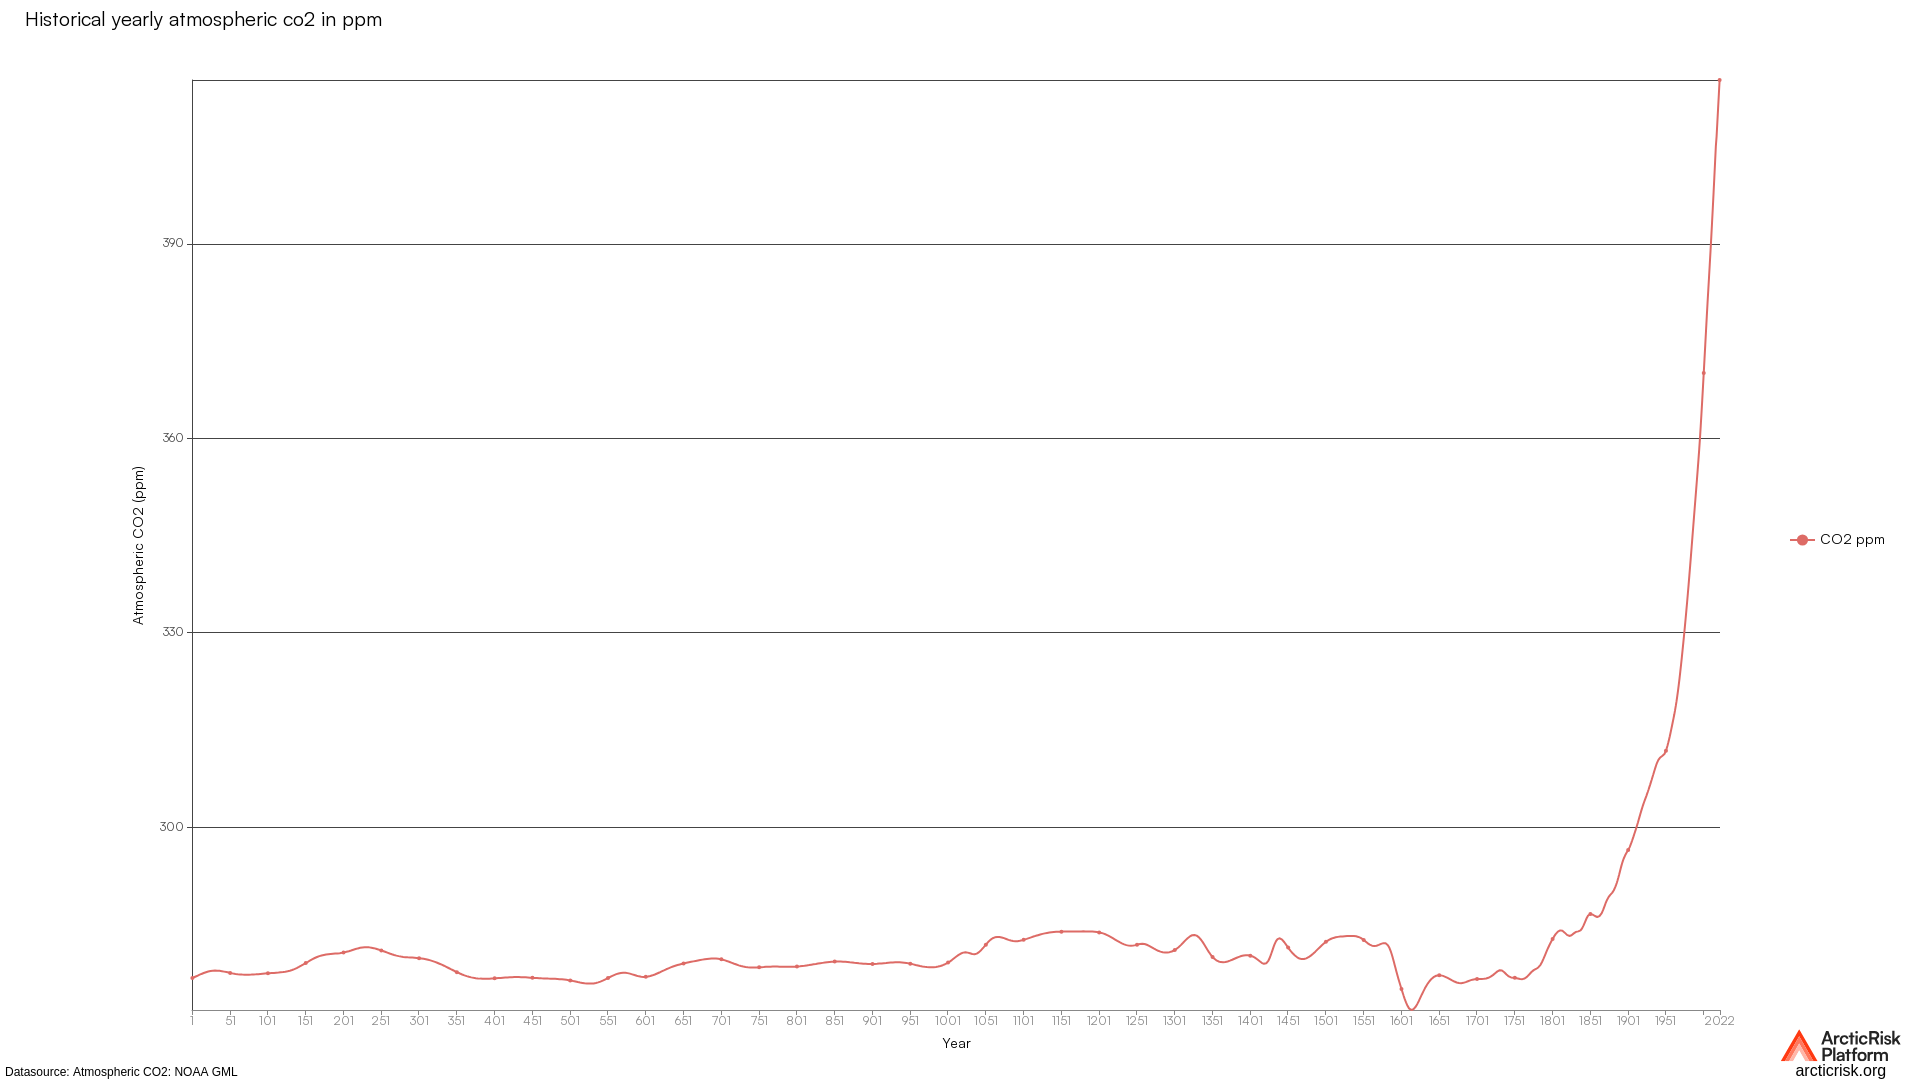
Monthly trends in Atmospheric Carbon Dioxide. Derived from datasource available at NOAA Global Monitoring Laboratory.


Greenland''s daily surface melt extent data. Derived from datasource available at NSIDC''s Greenland Today Melt Analysis data spreadsheet.


Greenland''s daily surface melt extent data. Derived from datasource available at NSIDC''s Greenland Today Melt Analysis data spreadsheet.


Discharge data from the Watson River were gathered for the Programme for Monitoring of the Greenland Ice Sheet (PROMICE) by GEUS (2014-pres…


Greenland''s cumulative mass balance and its trend after removing annual seasonality. Derived from MB_SMB_D_BMB.csv file from datasource av…


Greenland''s daily surface melt extent data. Derived from datasource available at NSIDC''s Greenland Today Melt Analysis data spreadsheet.


Greenland''s cumulative mass balance and its trend after removing annual seasonality. Derived from MB_SMB_D_BMB.csv file from datasource av…


Greenland''s cumulative mass balance and its trend after removing annual seasonality. Derived from MB_SMB_D_BMB.csv file from datasource av…


Greenland''s cumulative mass balance and its trend after removing annual seasonality. Derived from MB_SMB_D_BMB.csv file from datasource av…


Tellus Level-4 Greenland Mass Anomaly Time Series from JPL GRACE/GRACE-FO Mascon CRI Filtered Release 06.1 version 03