FREEZE: Climate Data Explorer

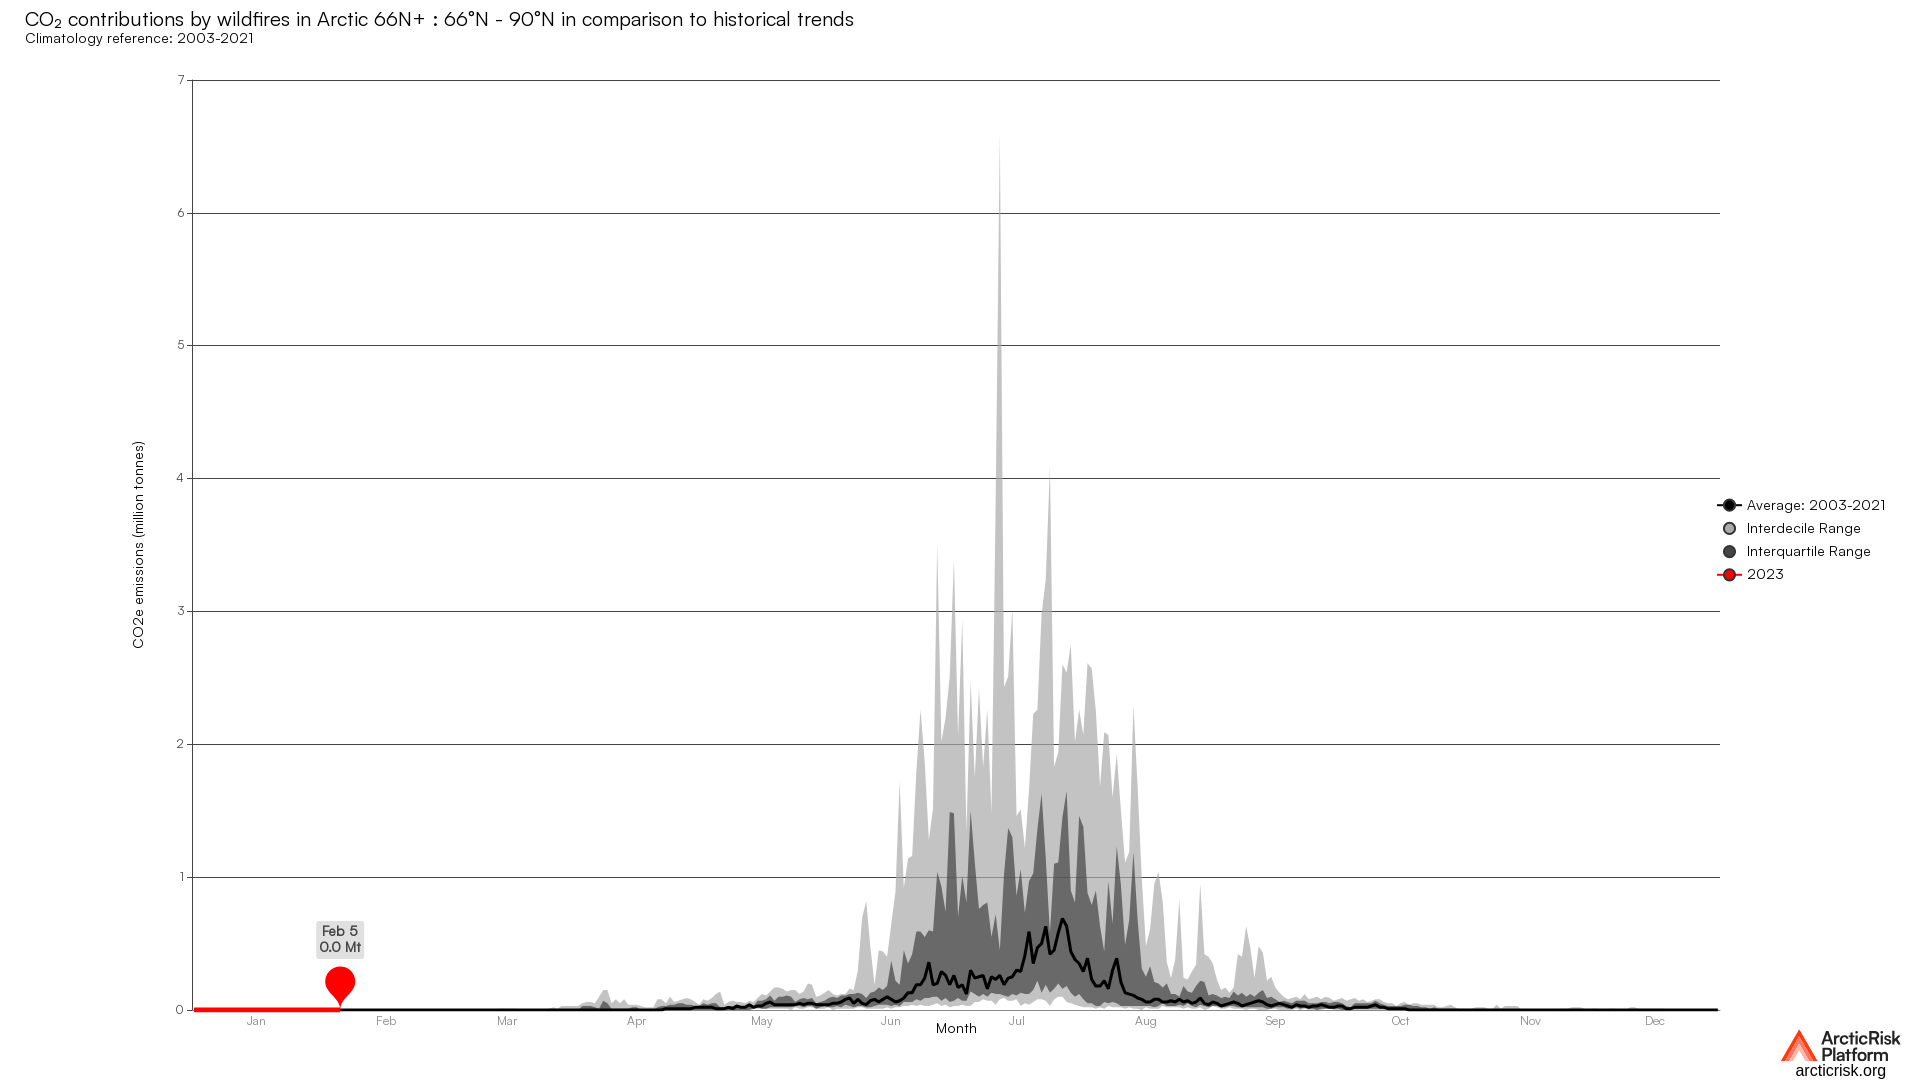
CO2 equivalent emissions in thousand tonnes caused by wild fires in different latitudnal regions . Dataset is based on Copernic…
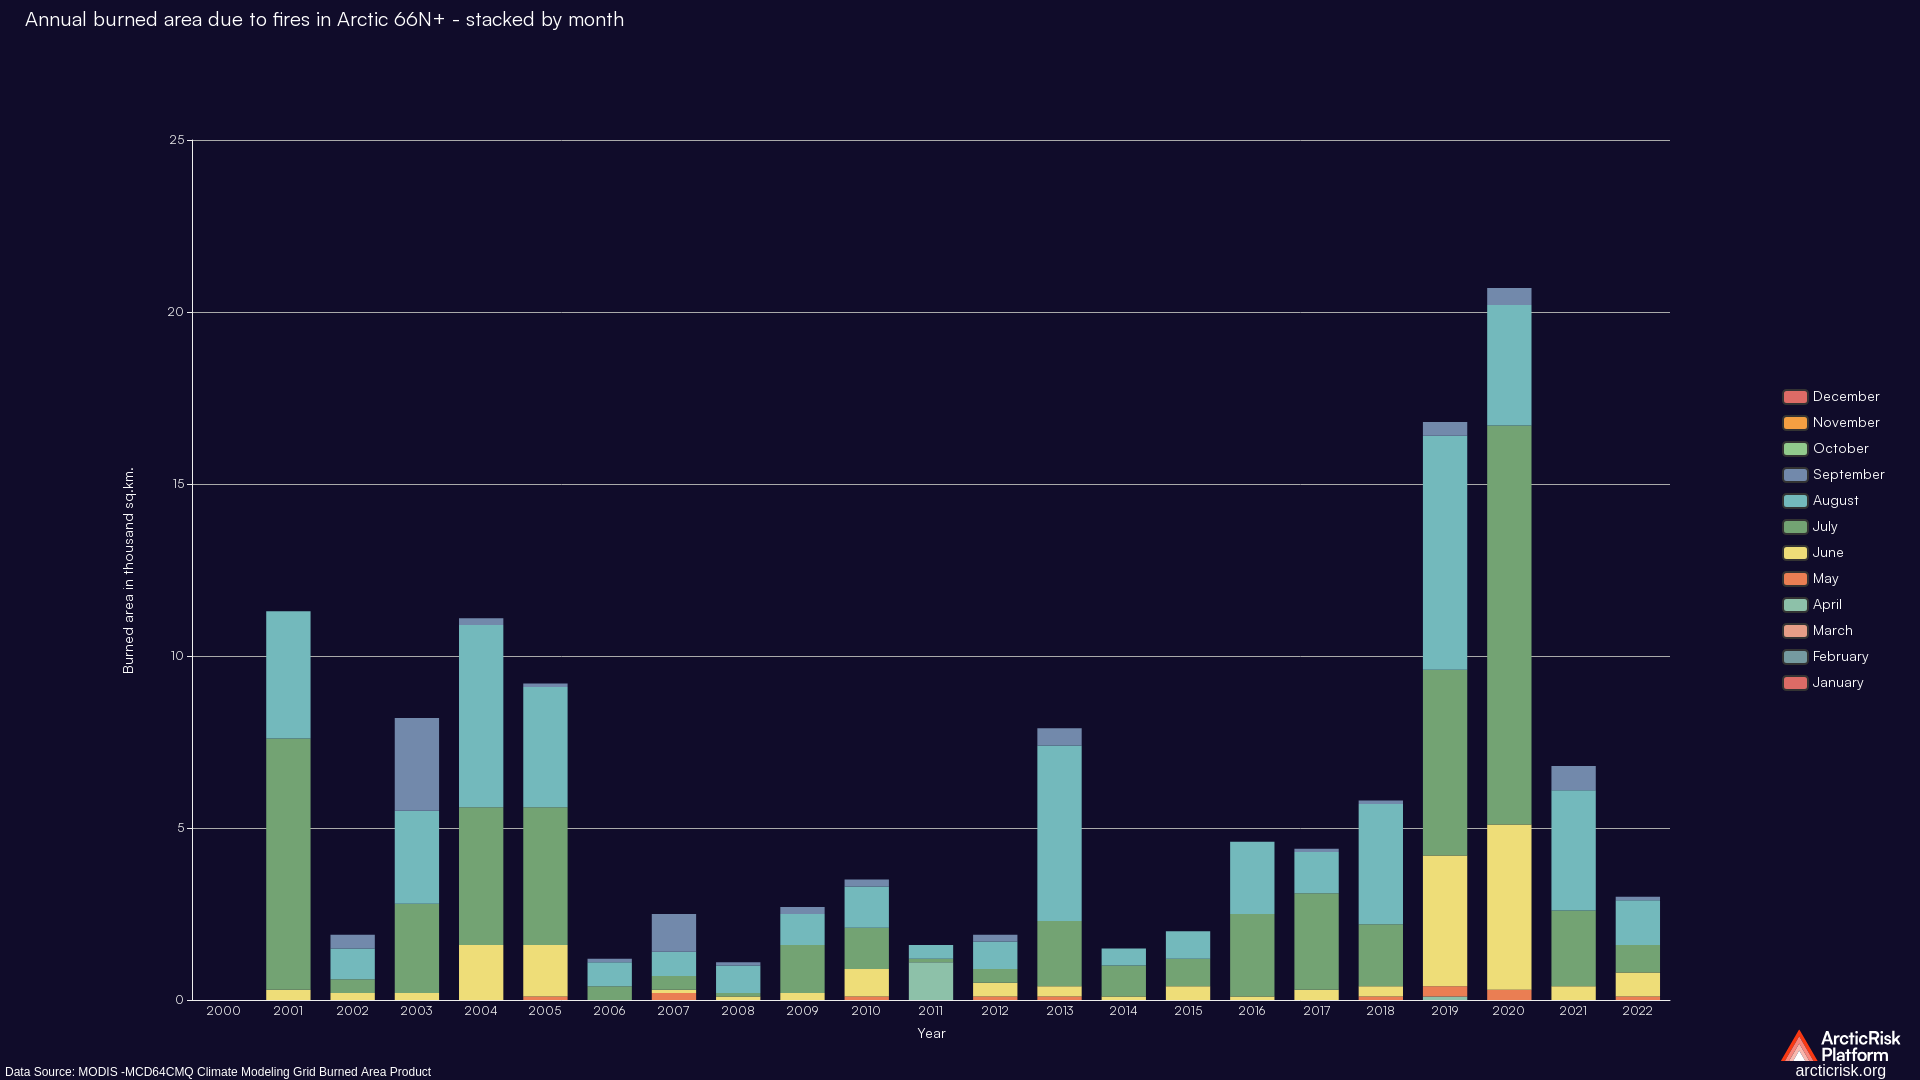
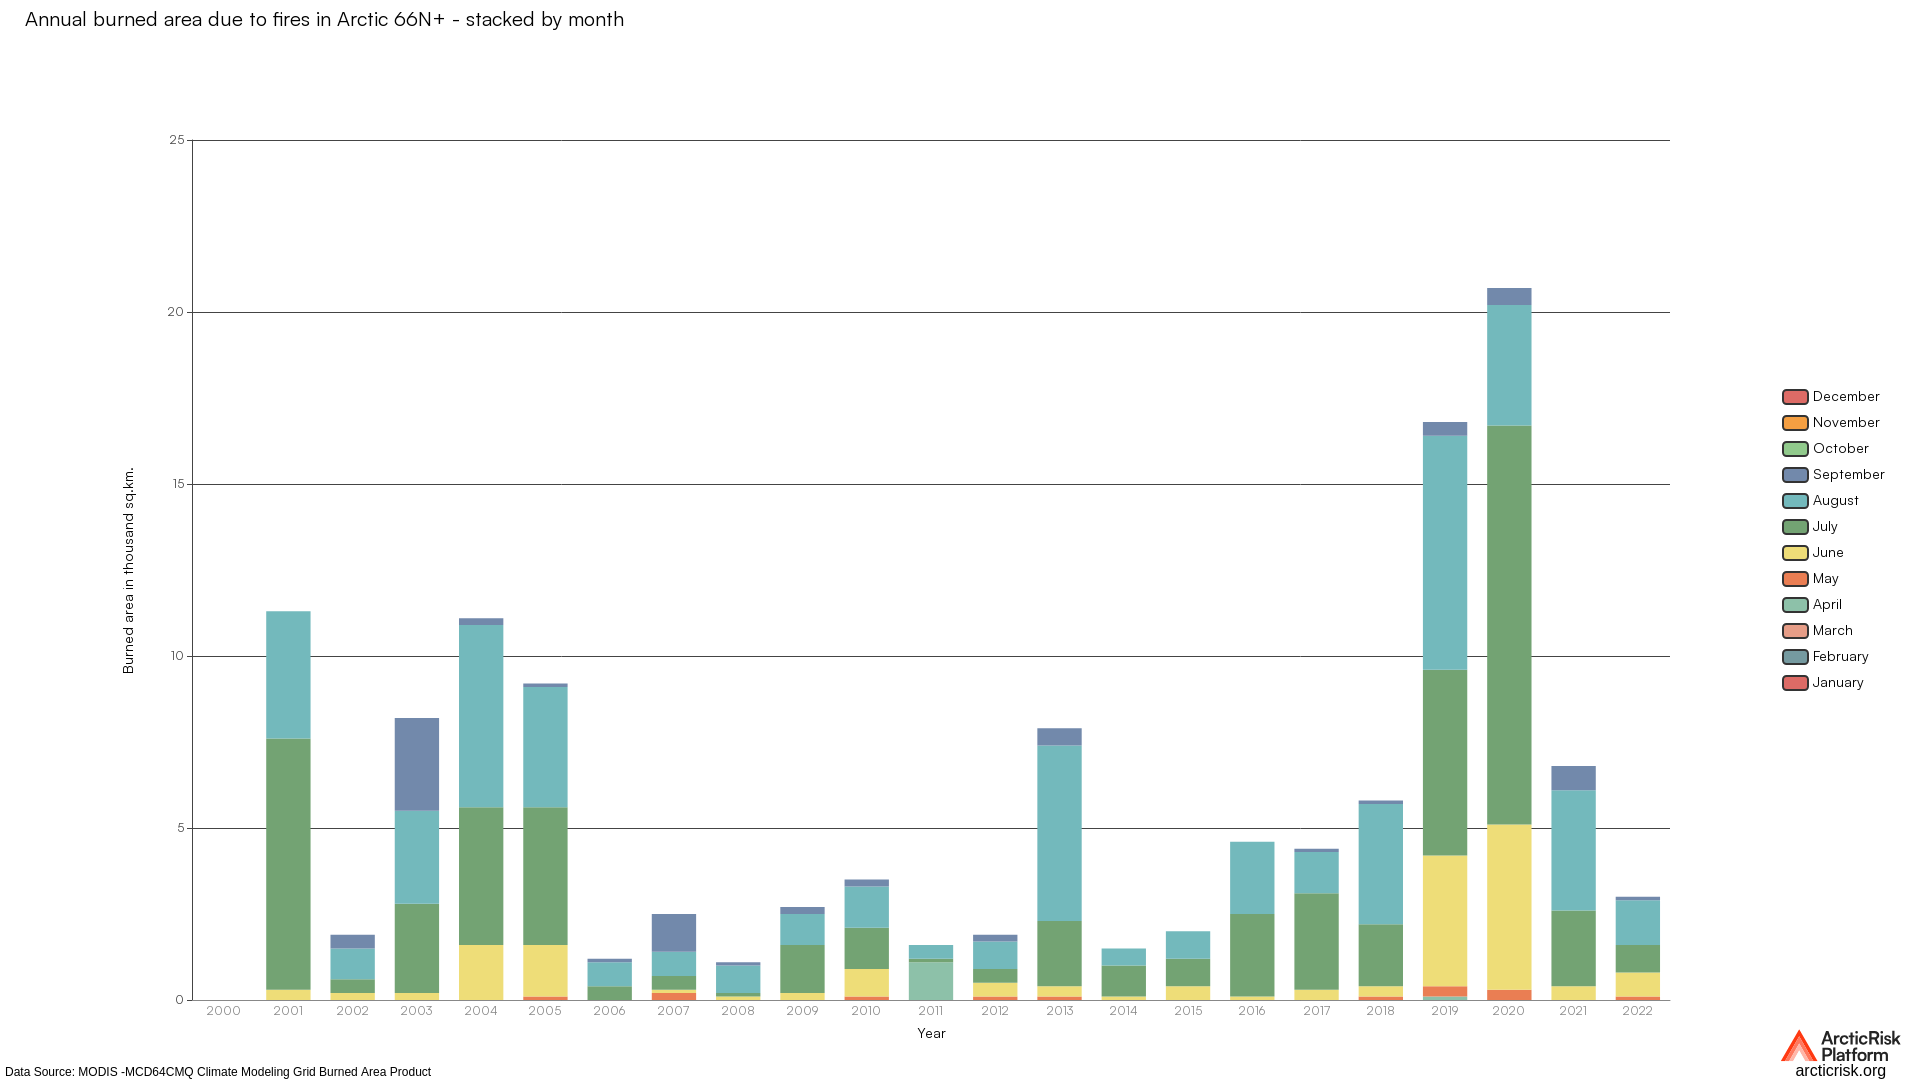
Monthly total burned area due to fires by latitudnal zones in square kilometres over the years. Data is based on NASA MODIS MCD64CMQ Climat…

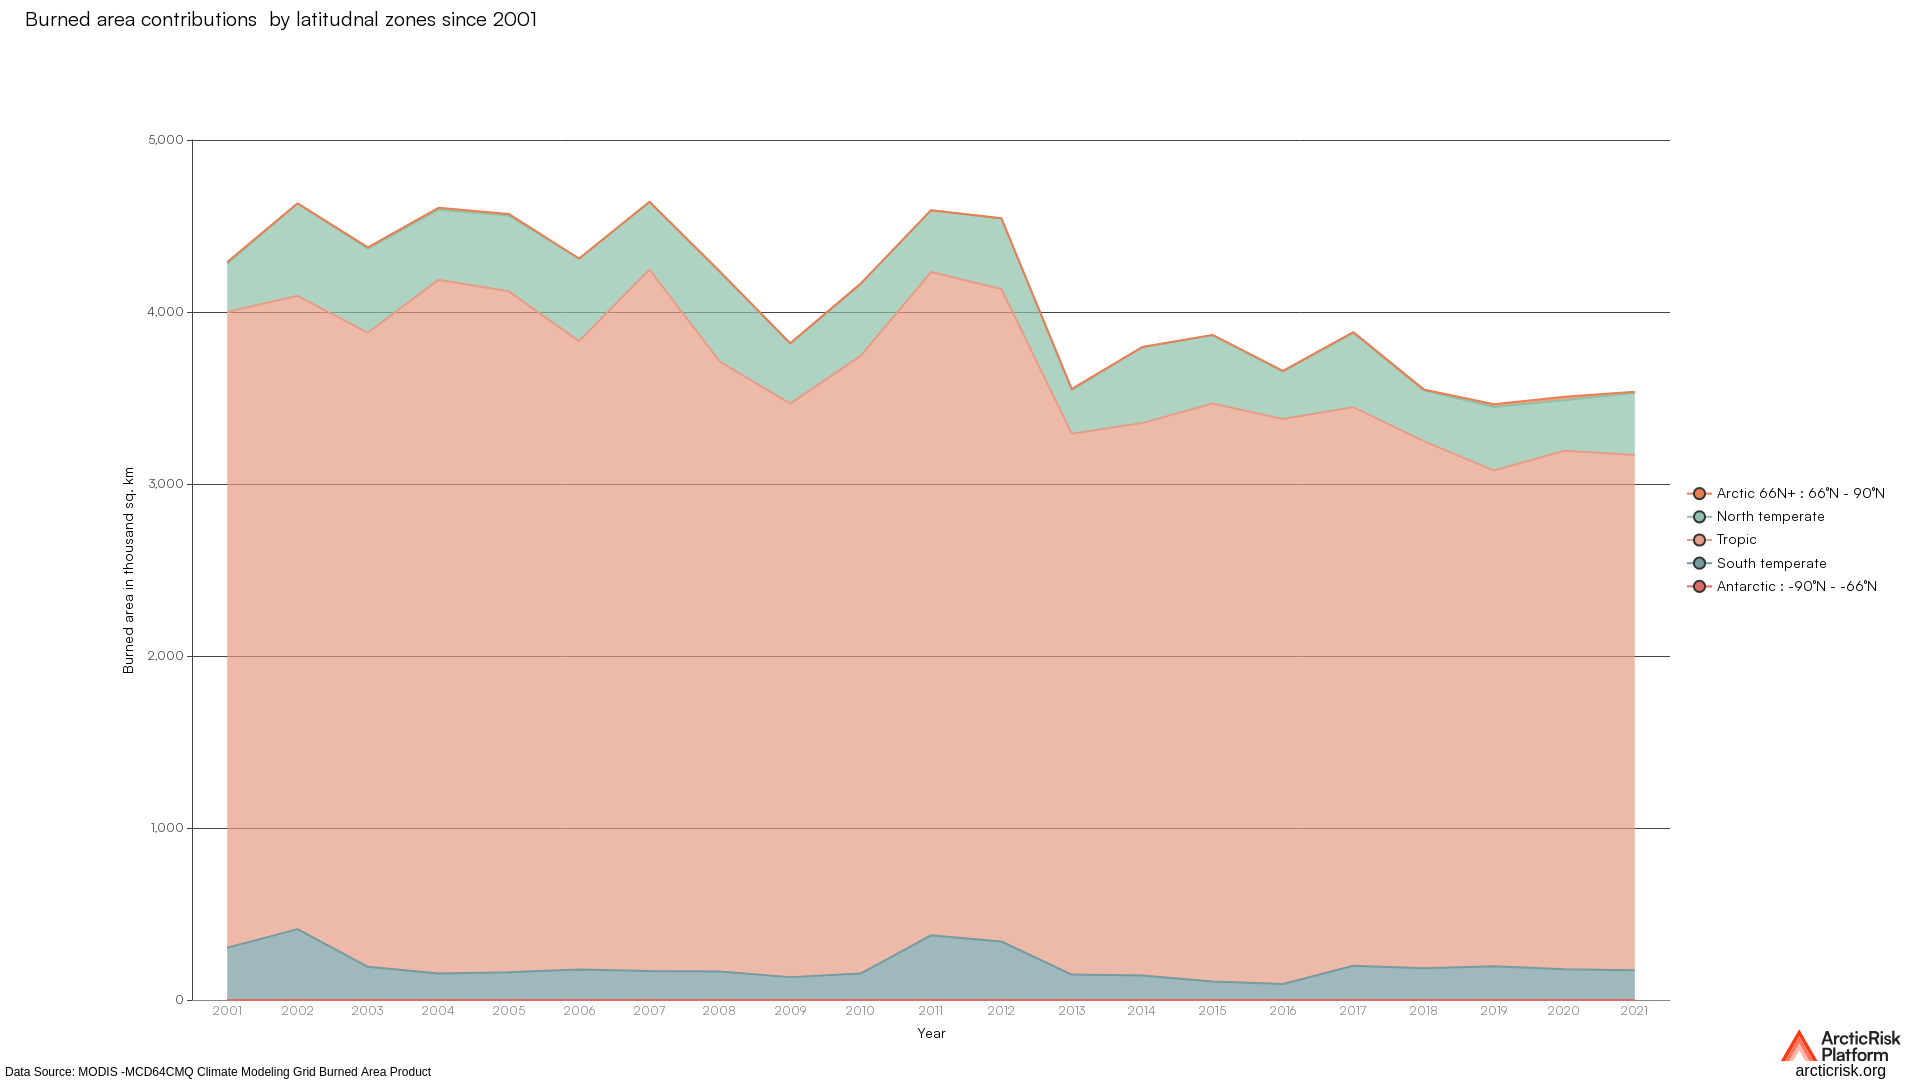
Monthly total burned area due to fires by latitudnal zones in square kilometres over the years. Data is based on NASA MODIS MCD64CMQ Climat…
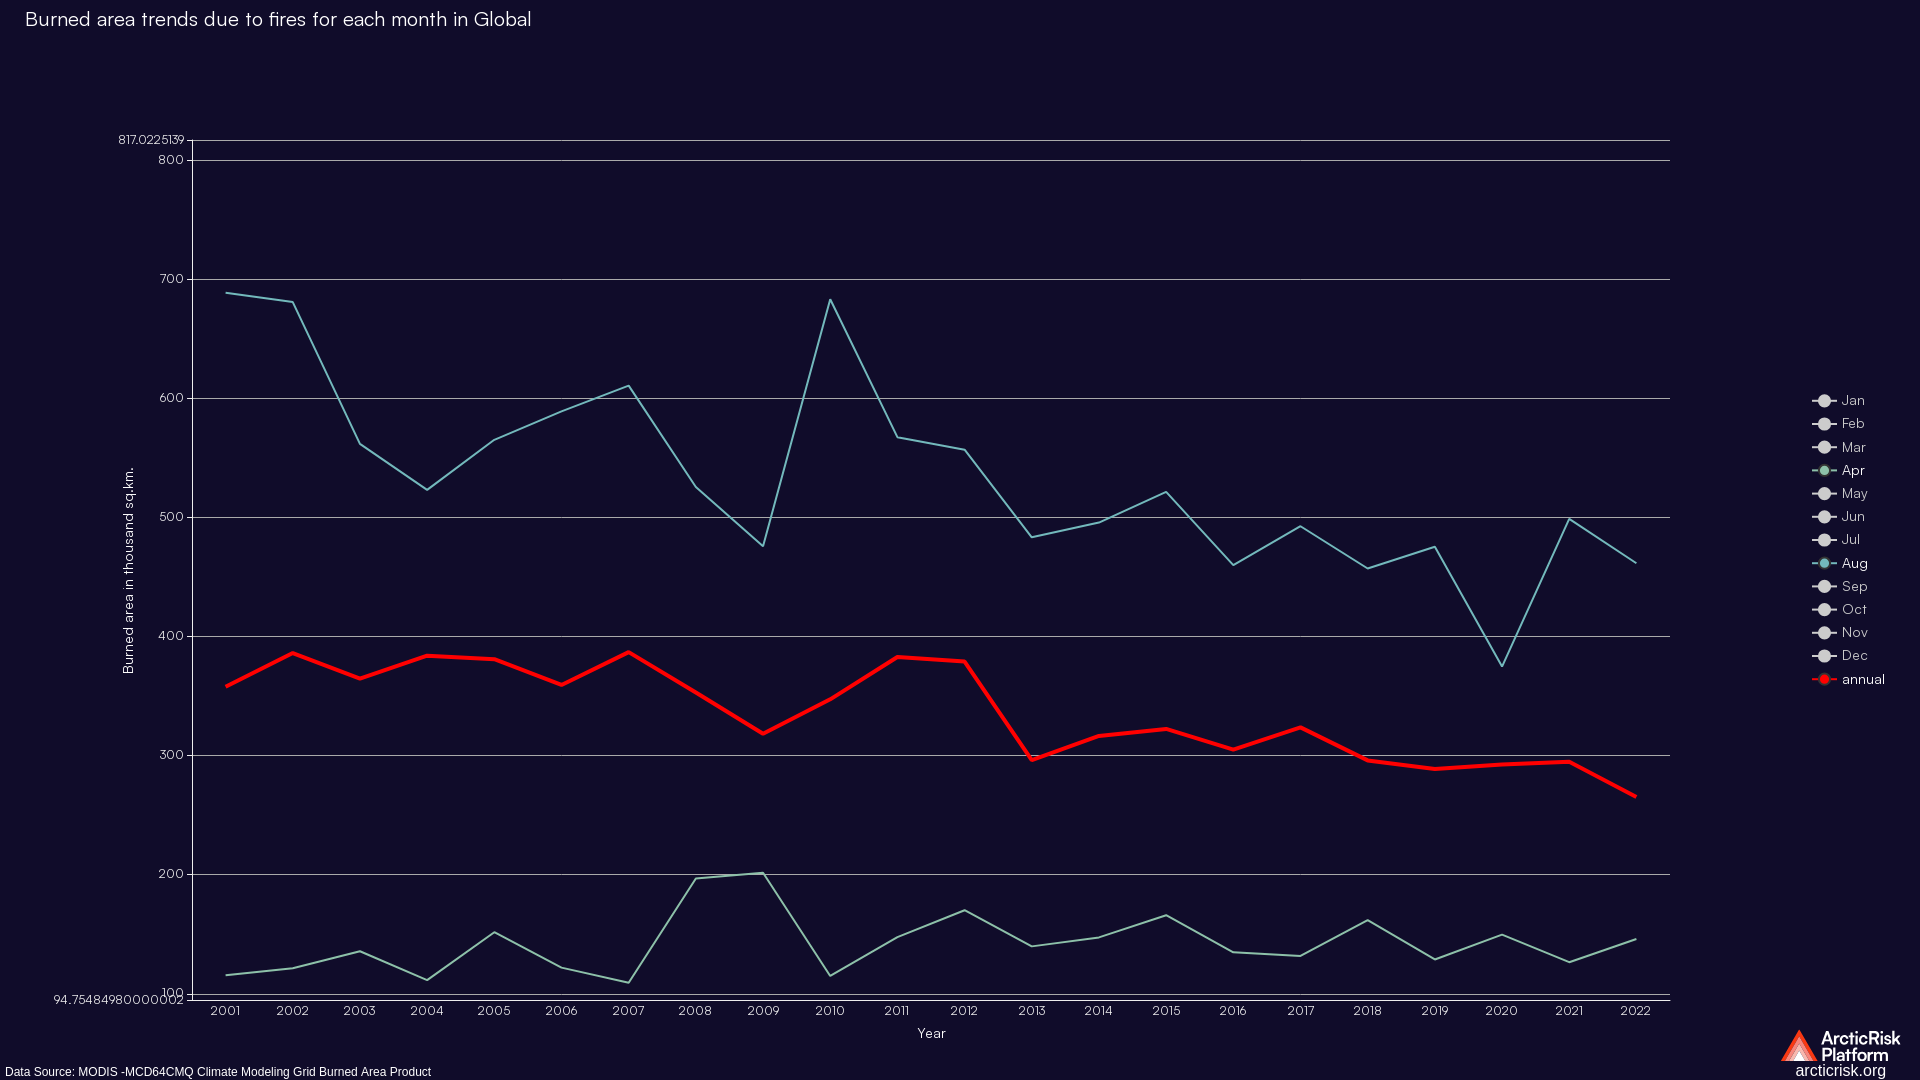
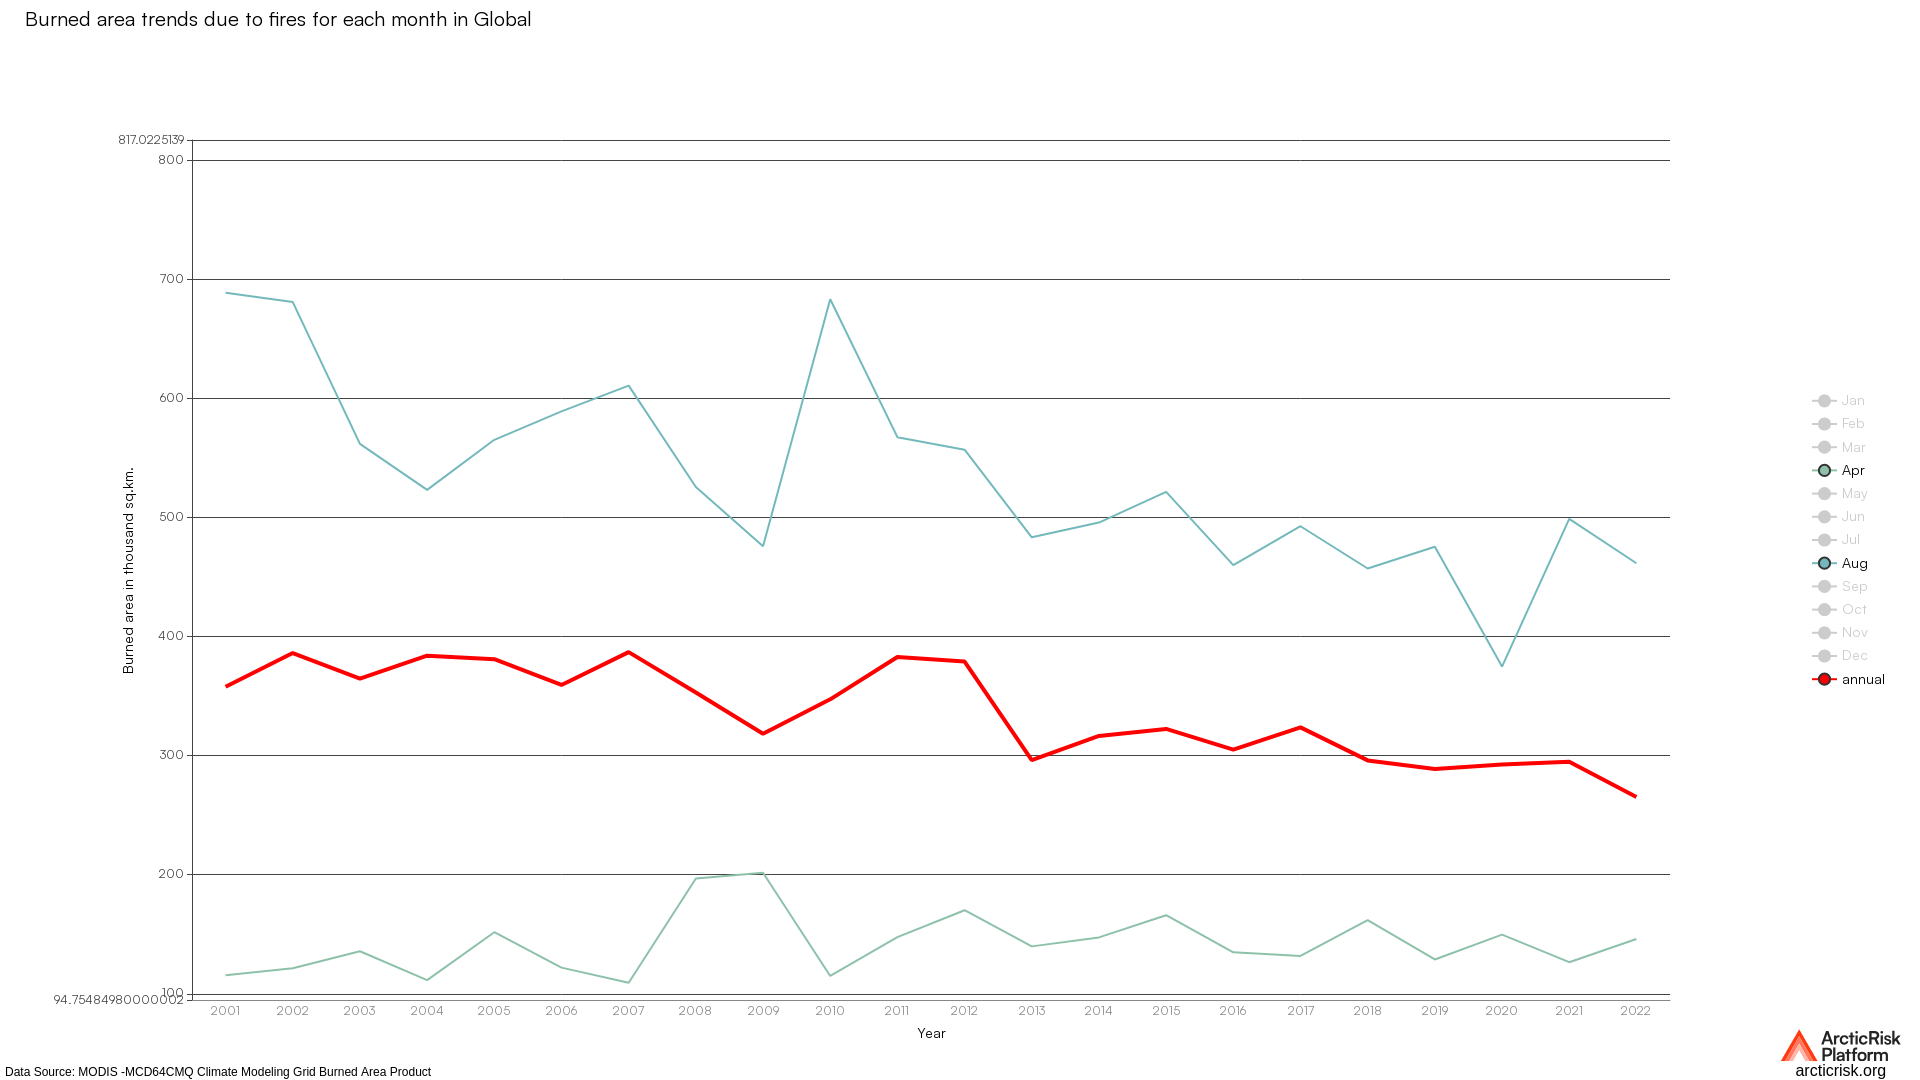
Monthly total burned area due to fires by latitudnal zones in square kilometres over the years. Data is based on NASA MODIS MCD64CMQ Climat…
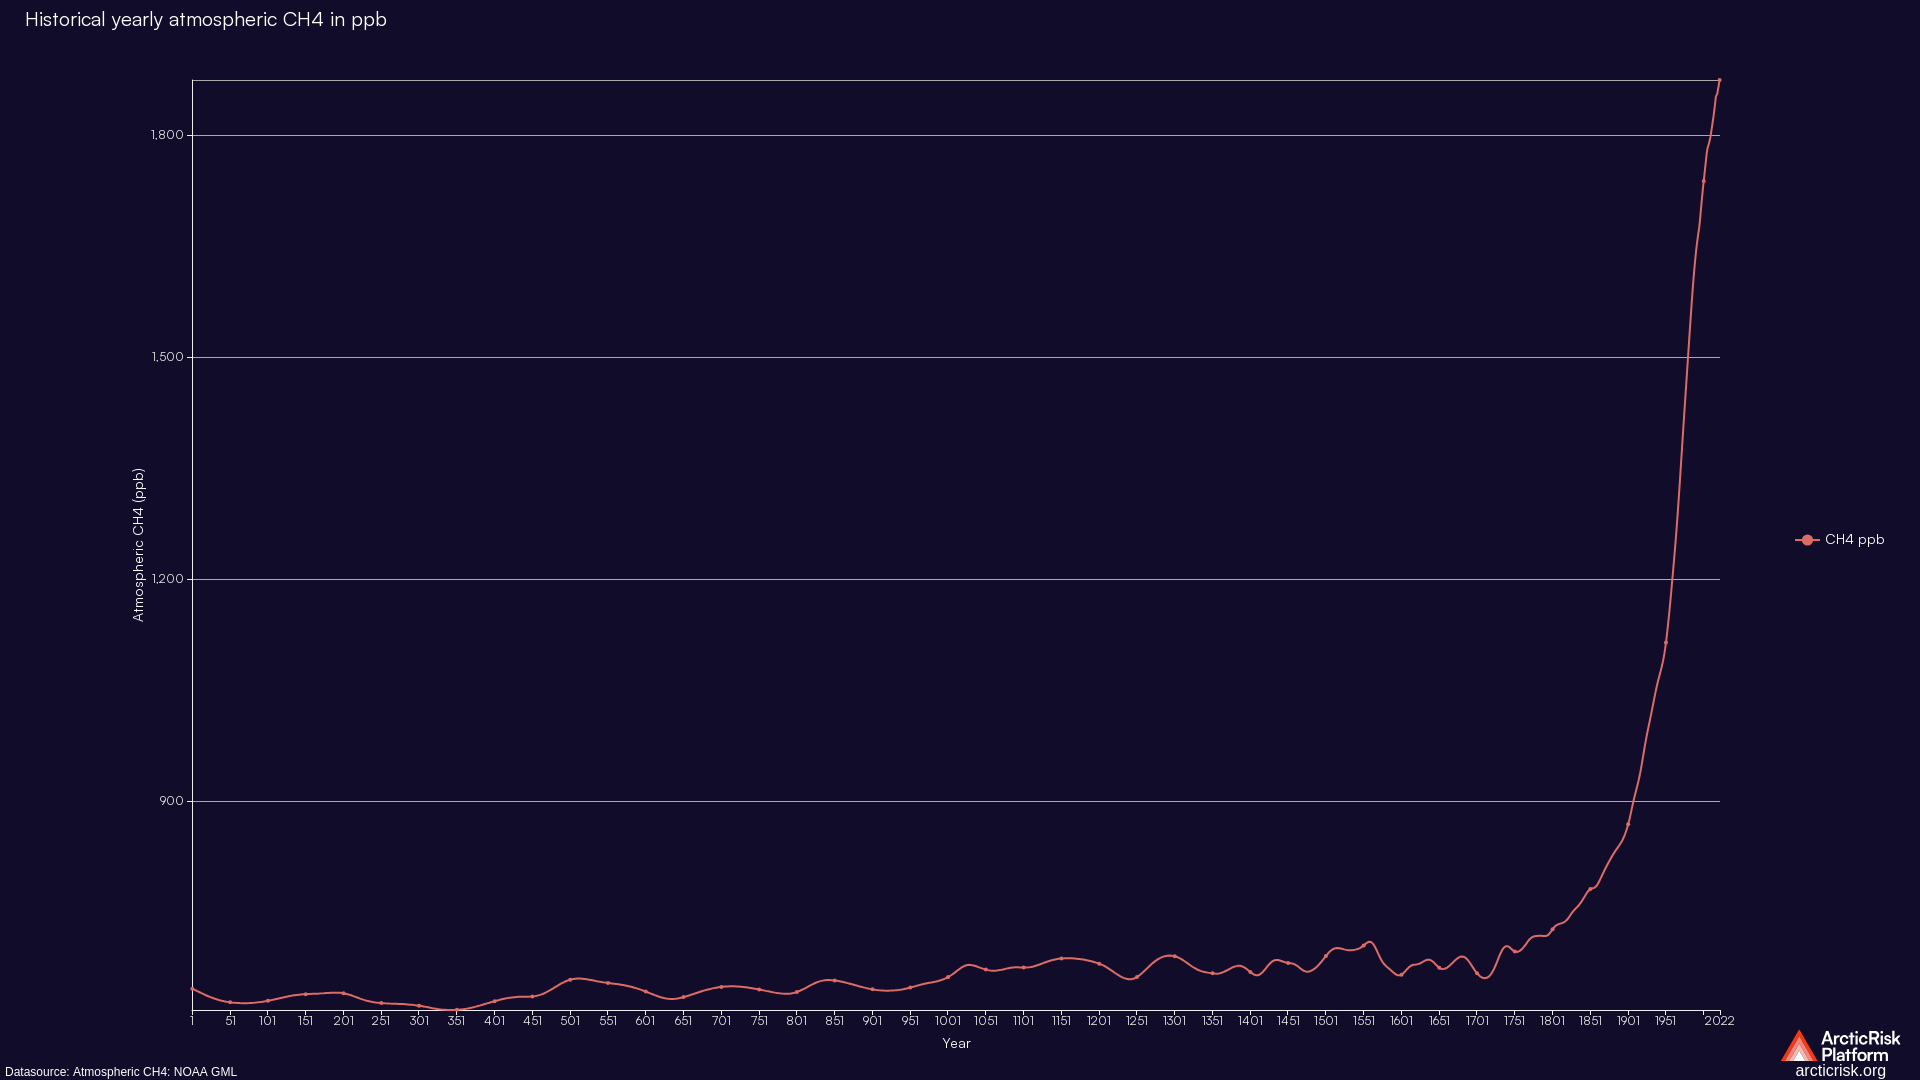
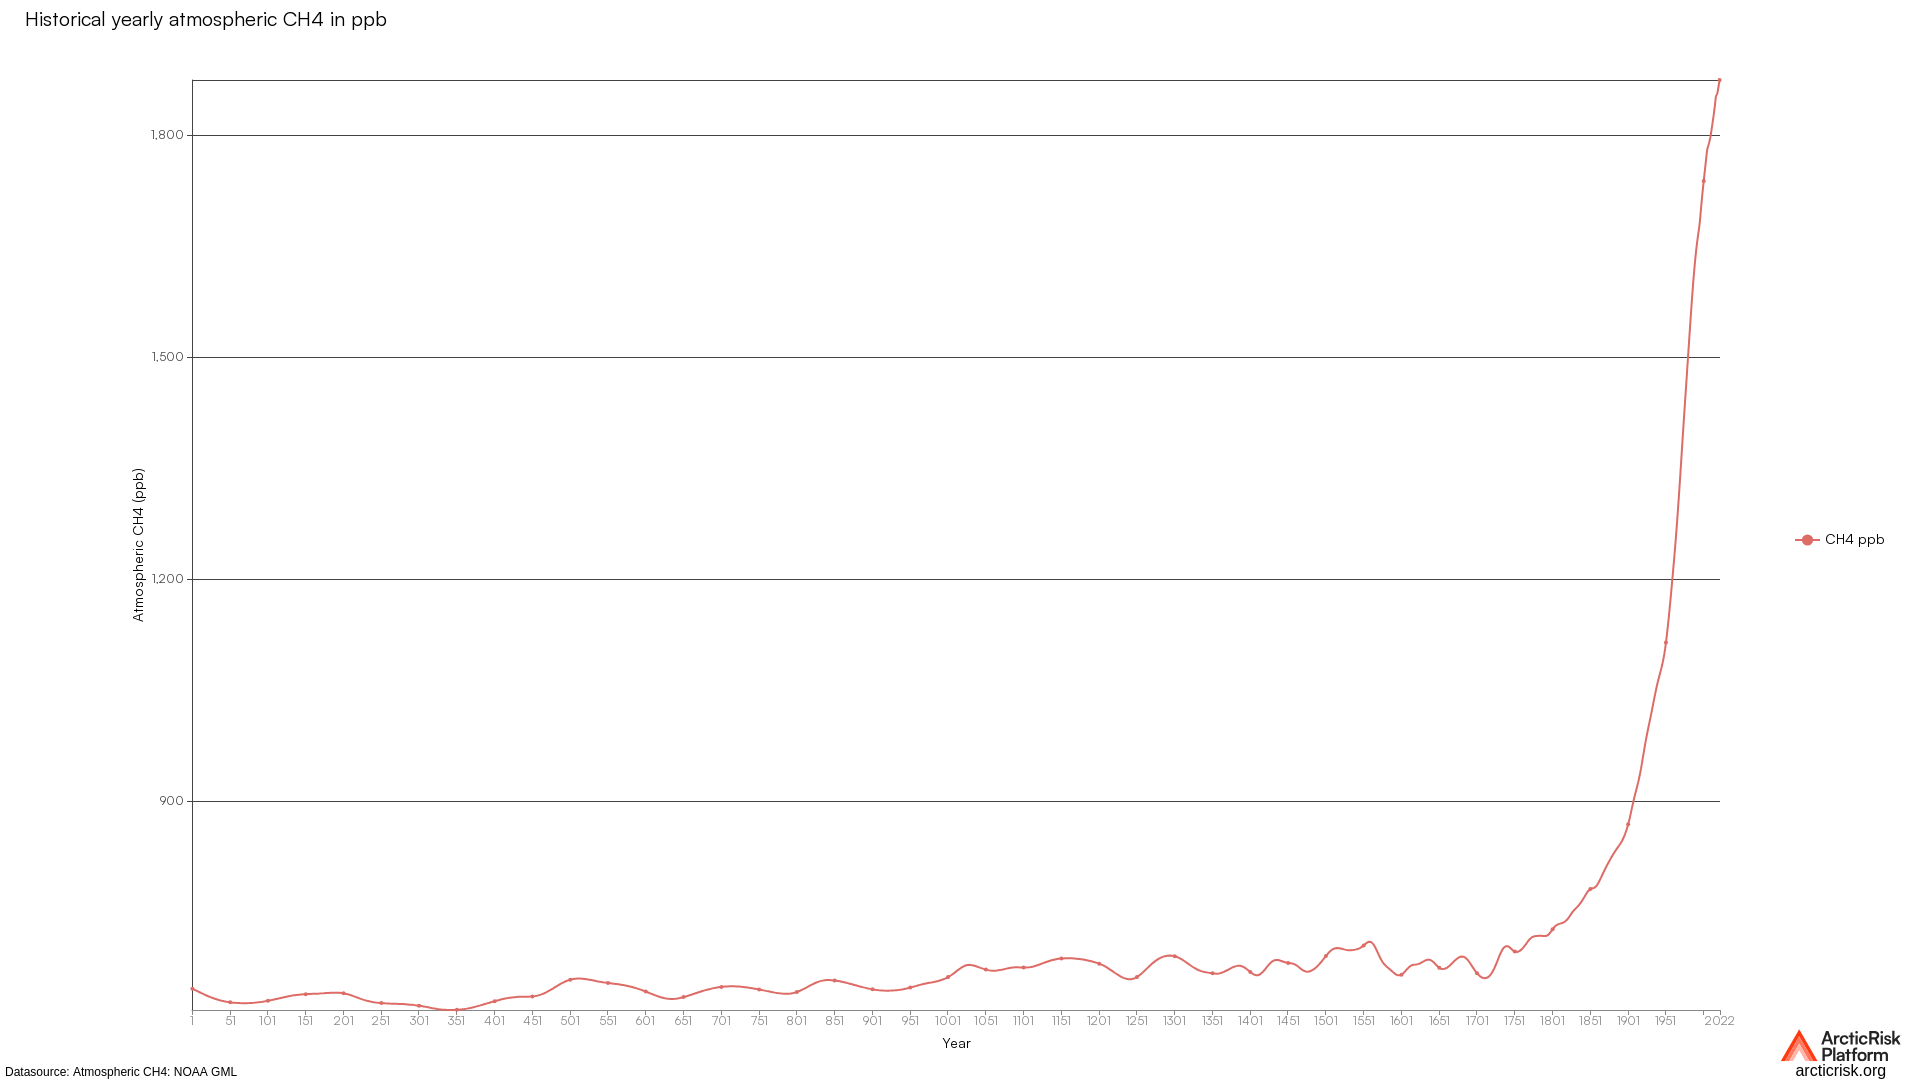
Monthly trends in Atmospheric Methane. Derived from datasource available at NOAA Global Monitoring Laboratory.
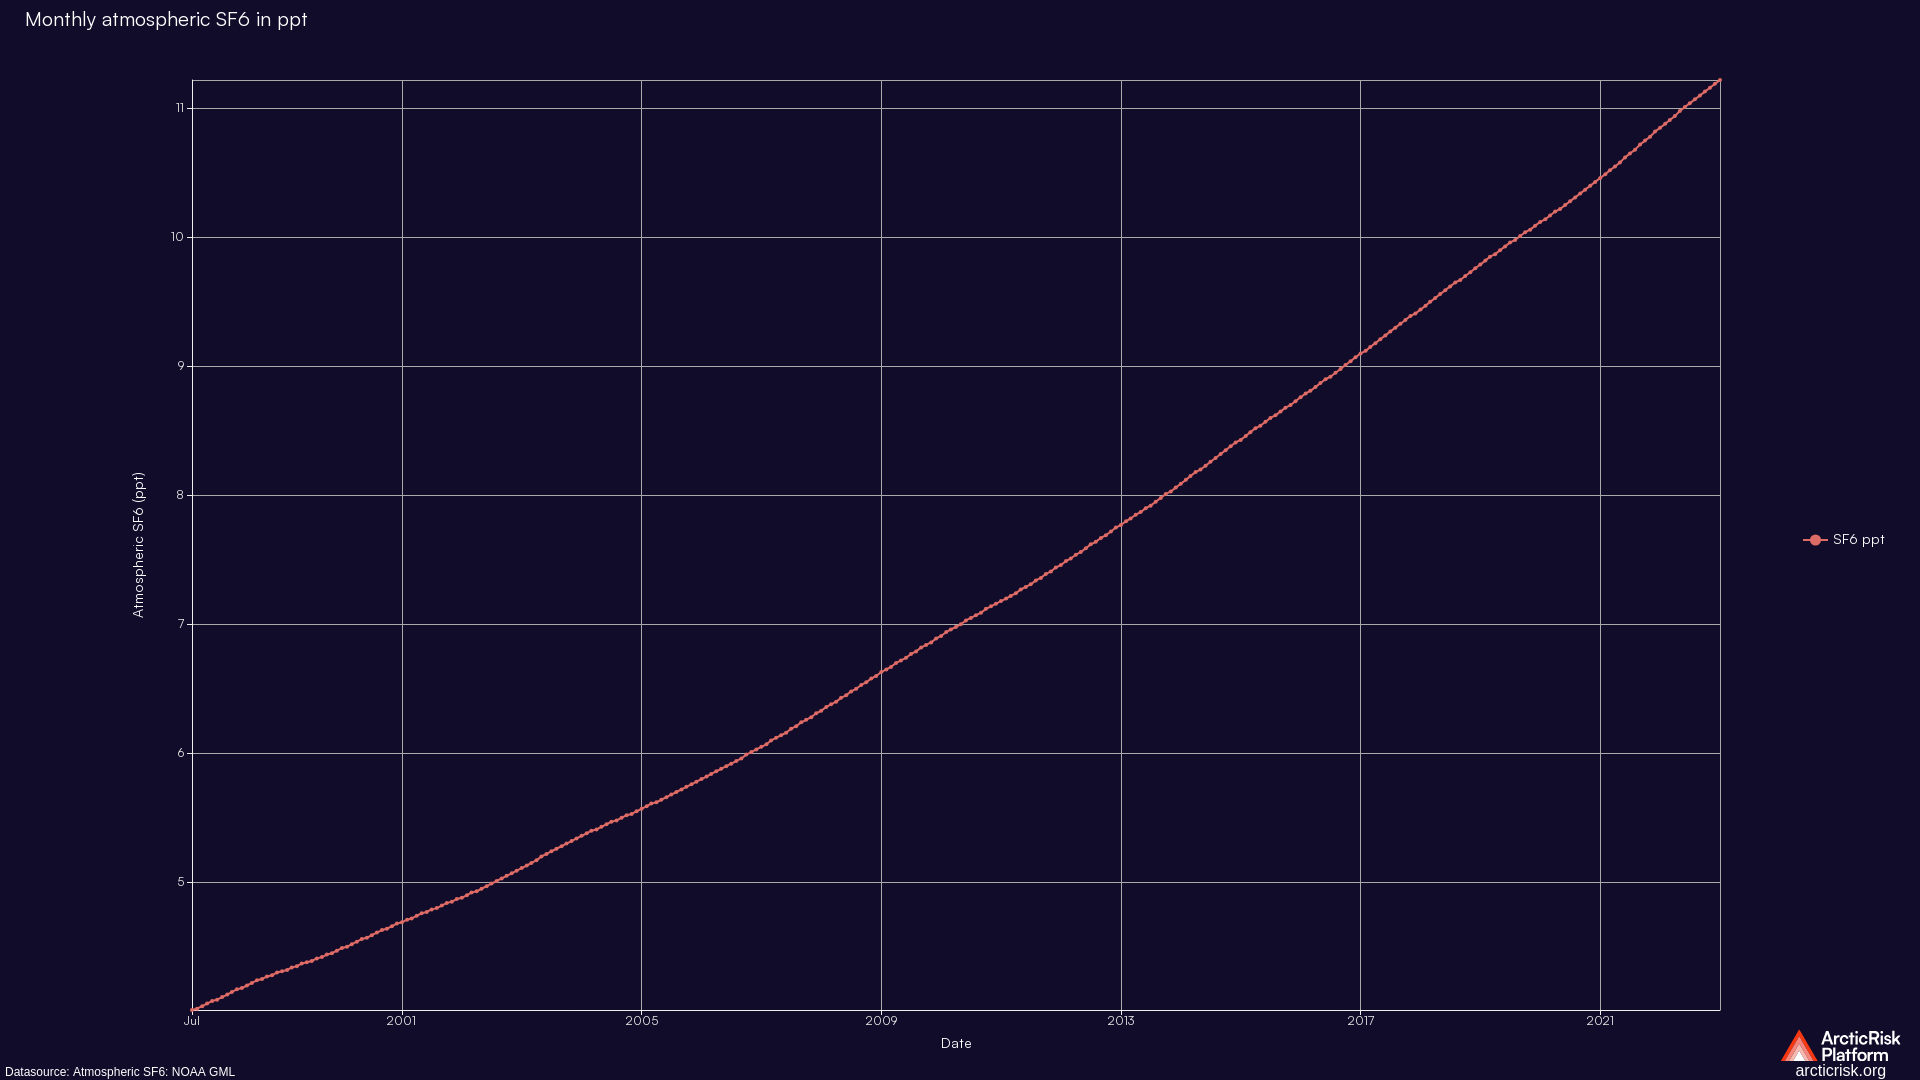
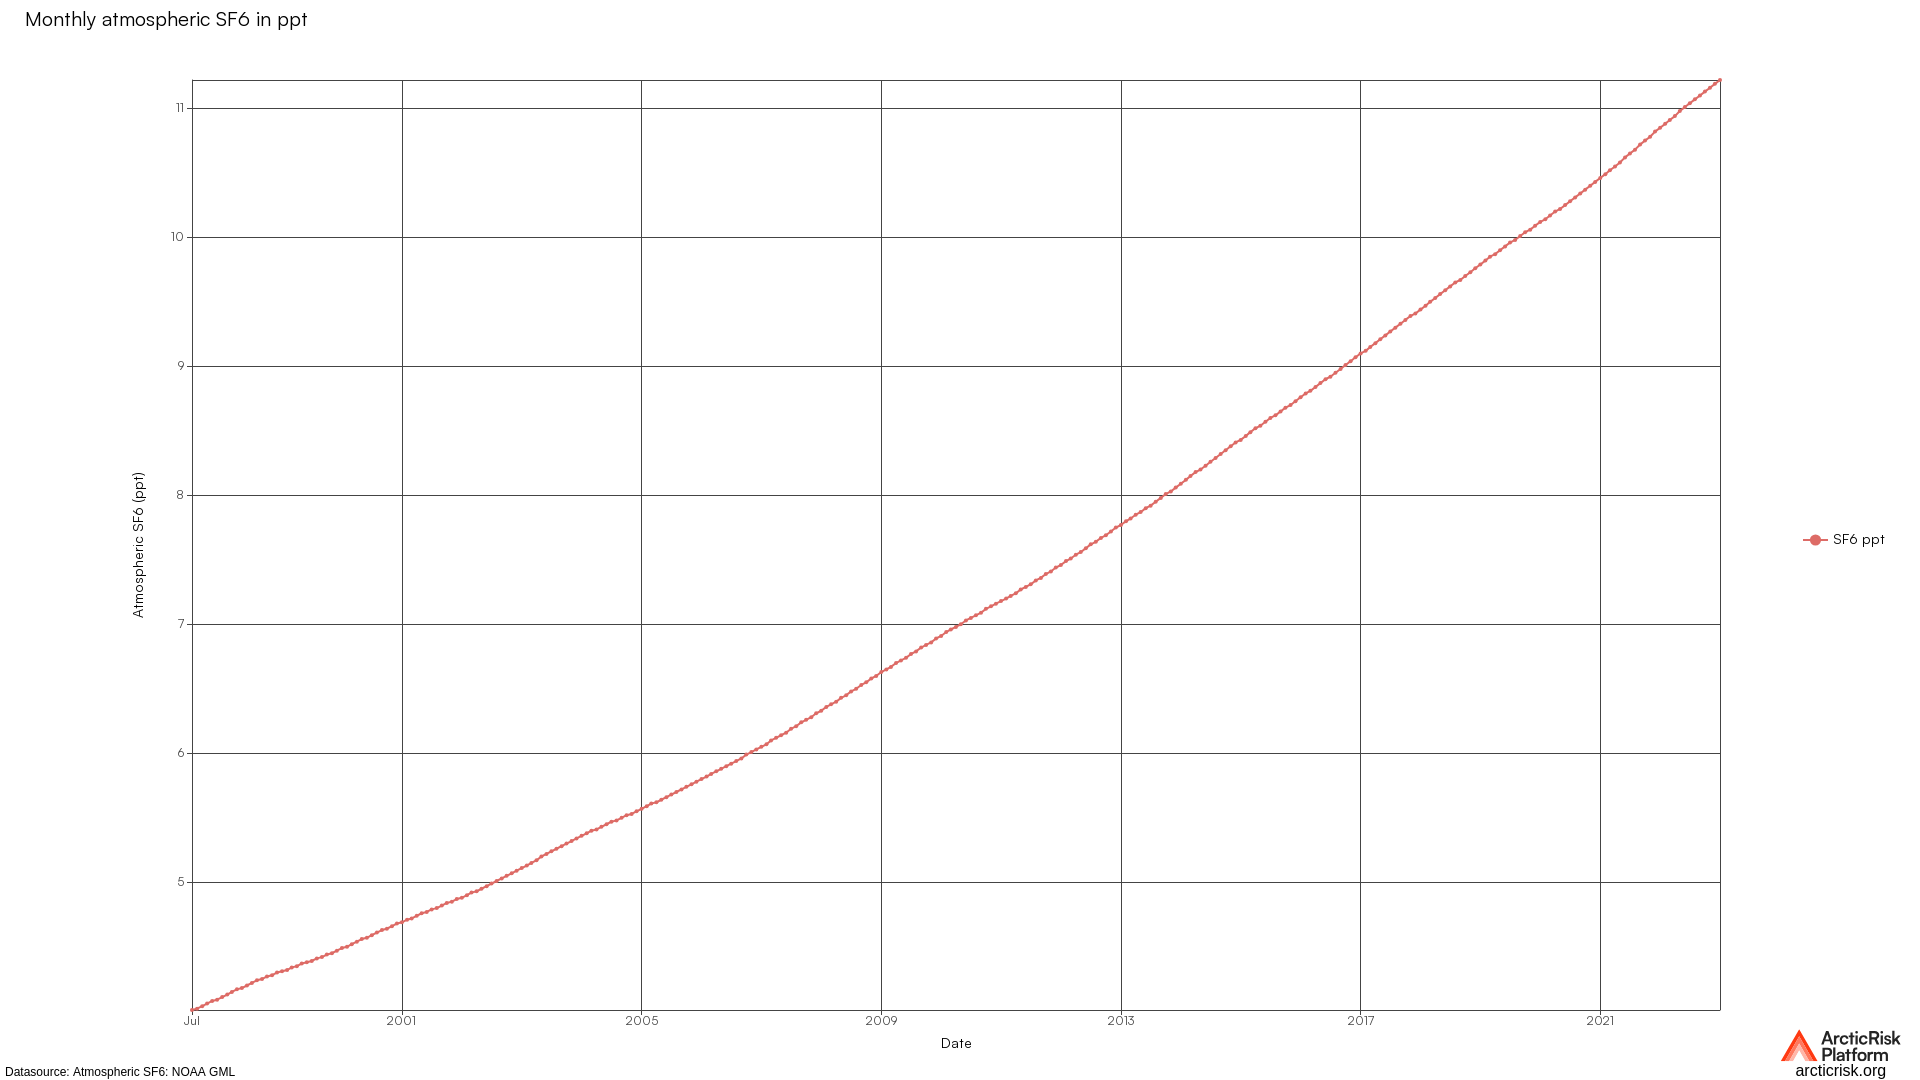
Monthly trends in Atmospheric Sulfur Hexaflouride. Derived from datasource available at NOAA Global Monitoring Laboratory.
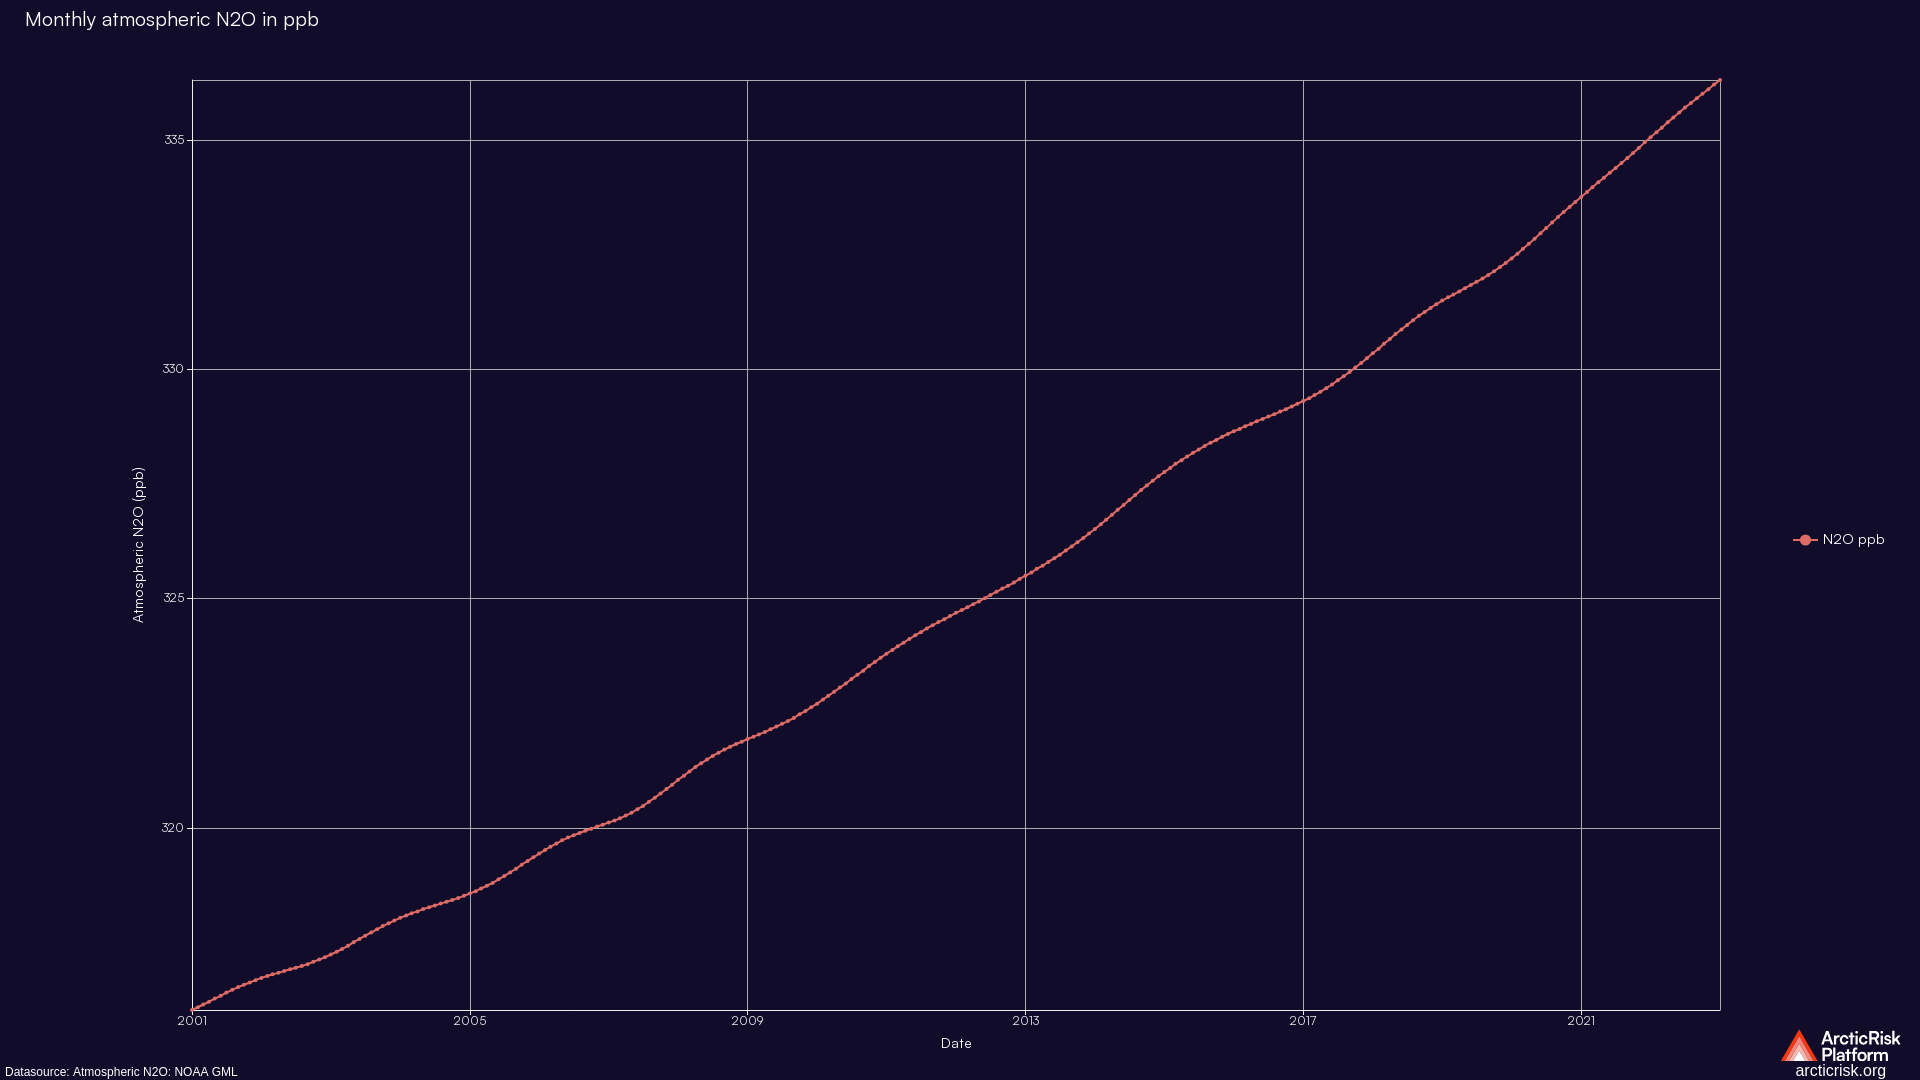
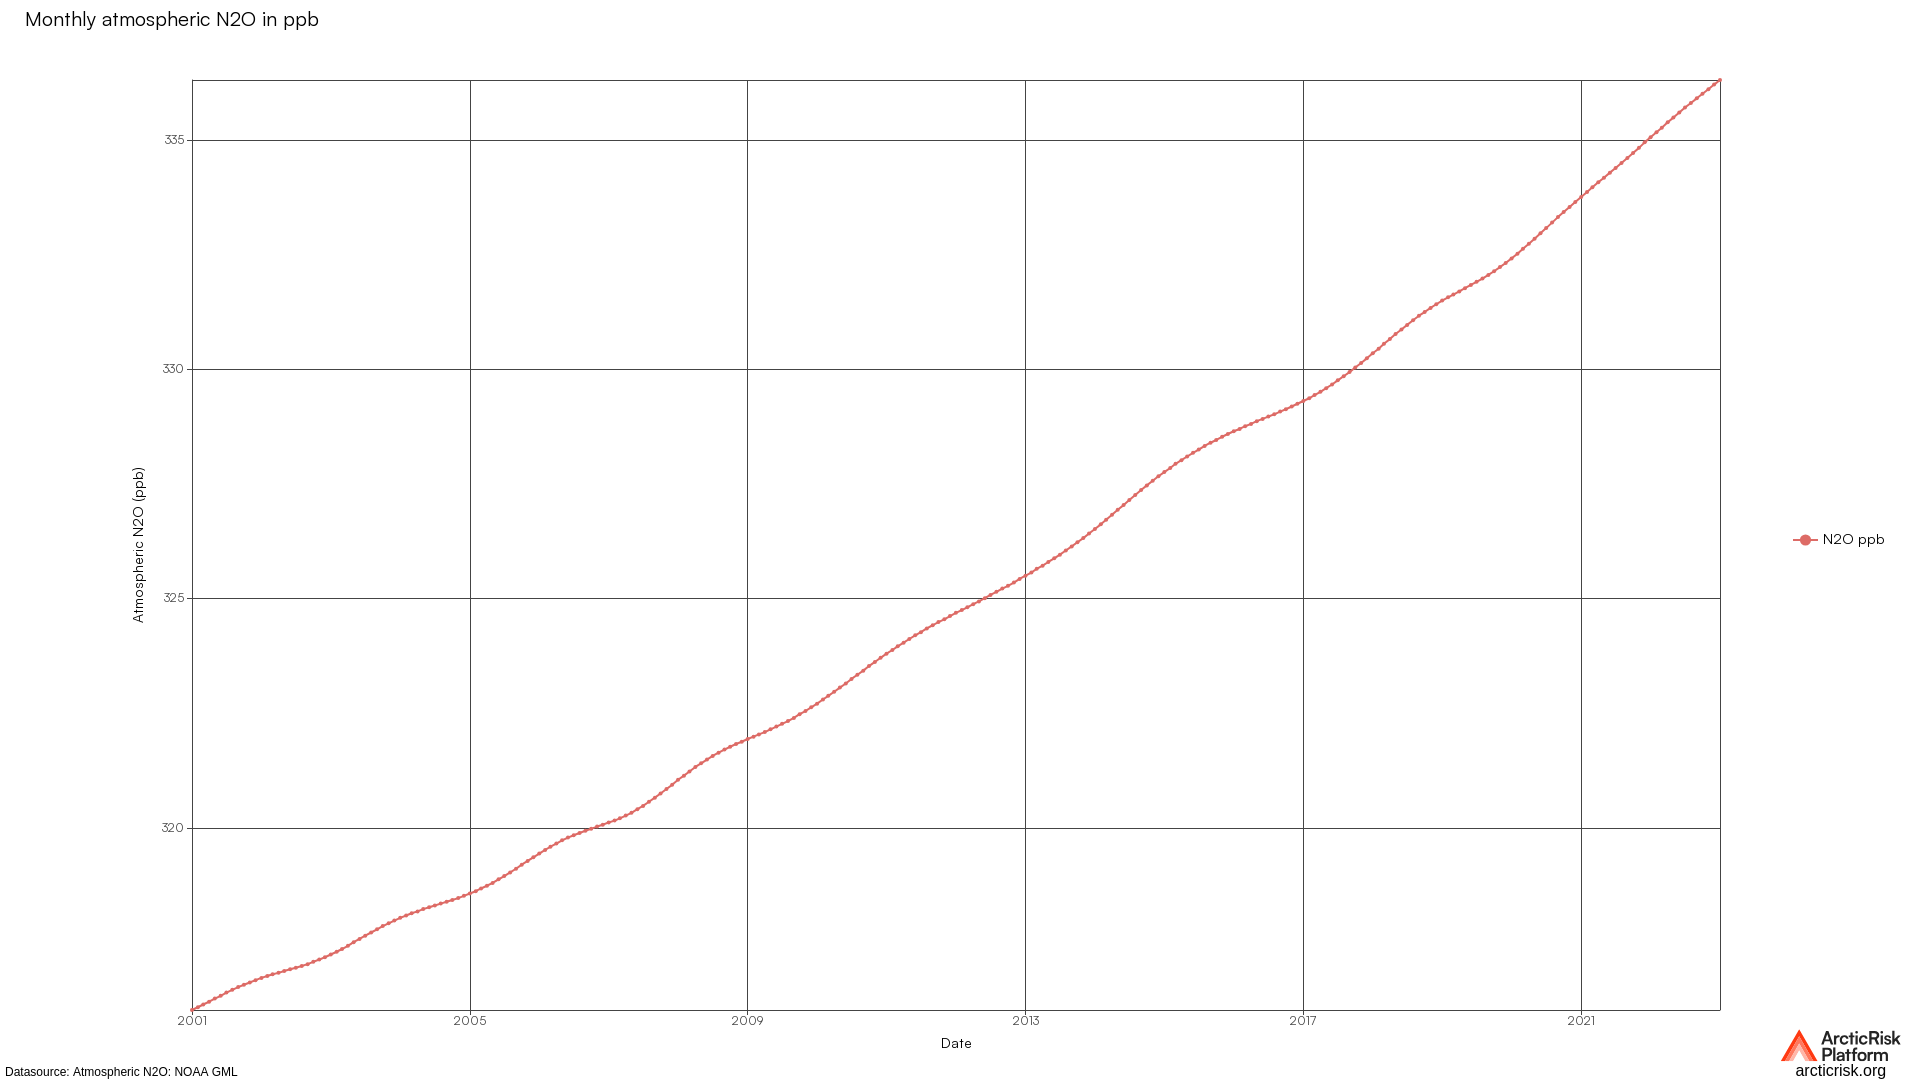
Monthly trends in Atmospheric N2O. Derived from datasource available at NOAA Global Monitoring Laboratory.


Monthly trends in Atmospheric N2O. Derived from datasource available at NOAA Global Monitoring Laboratory.
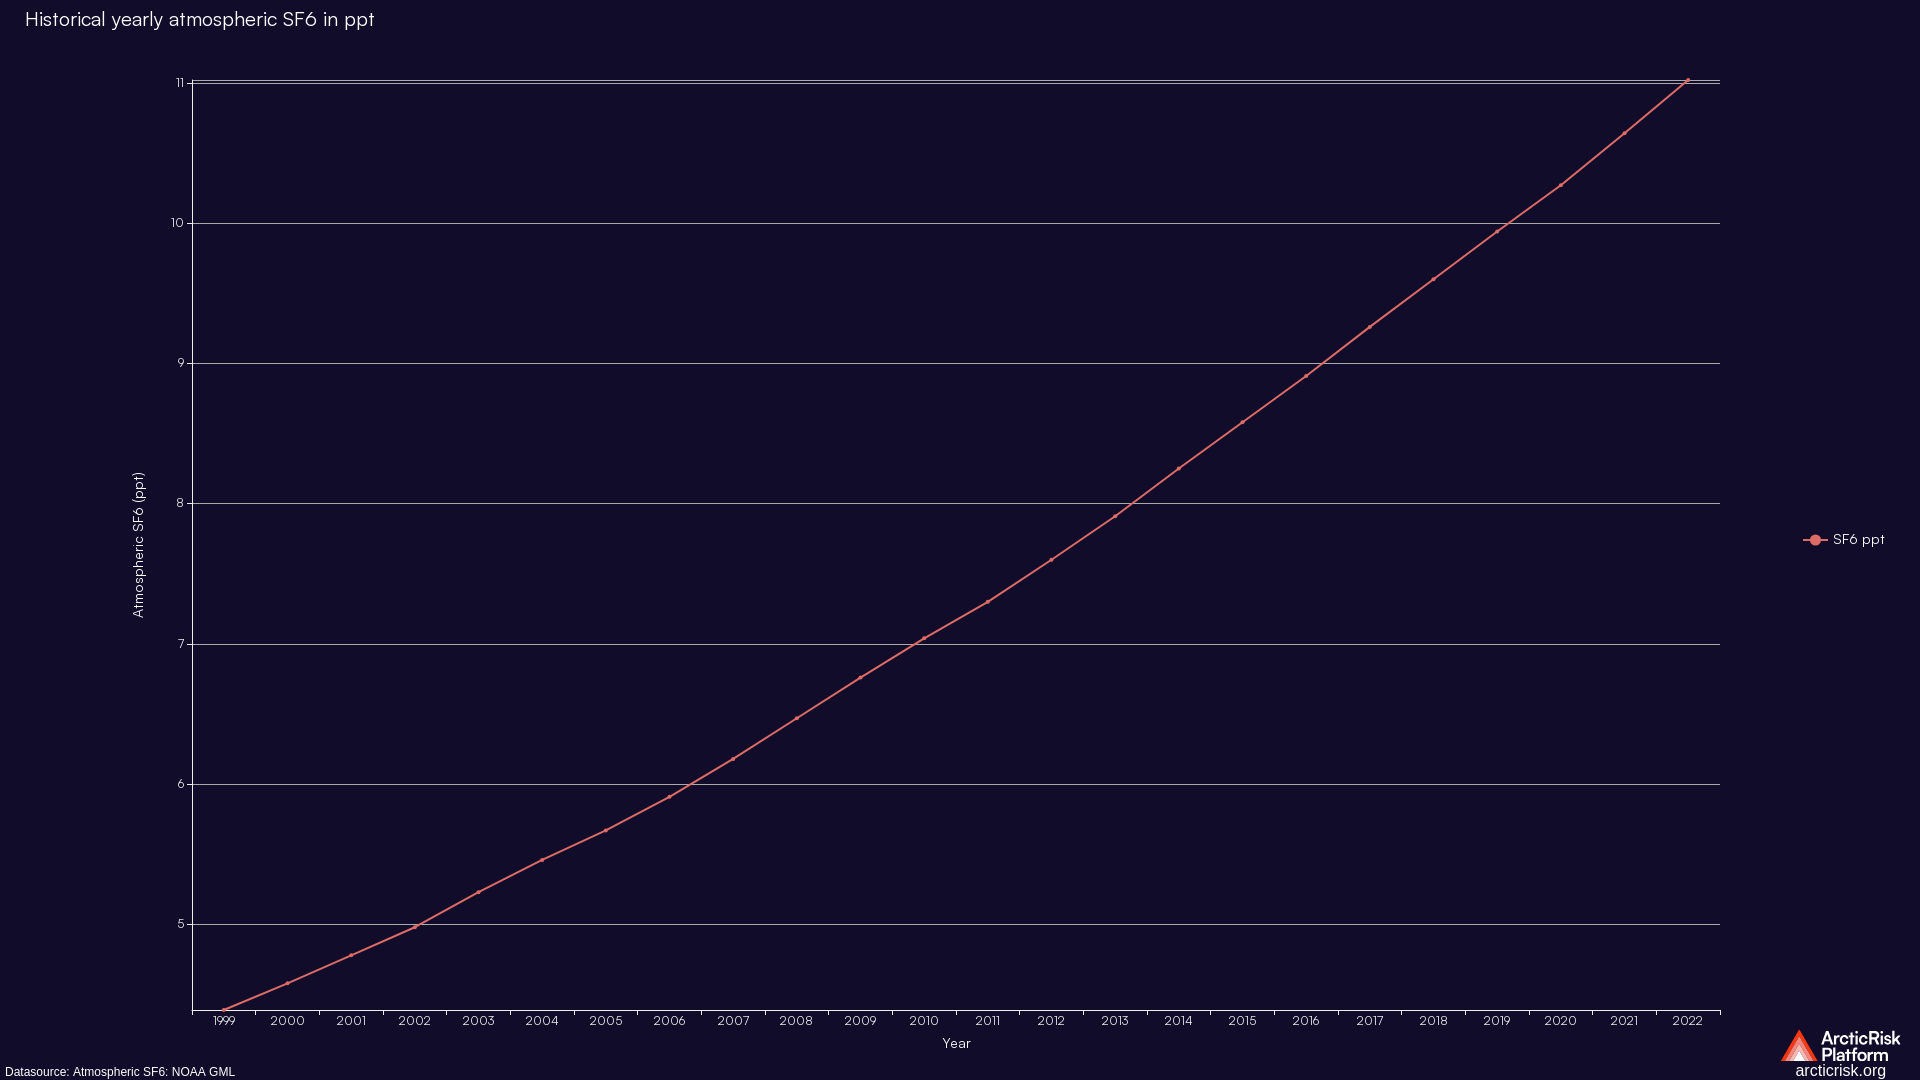
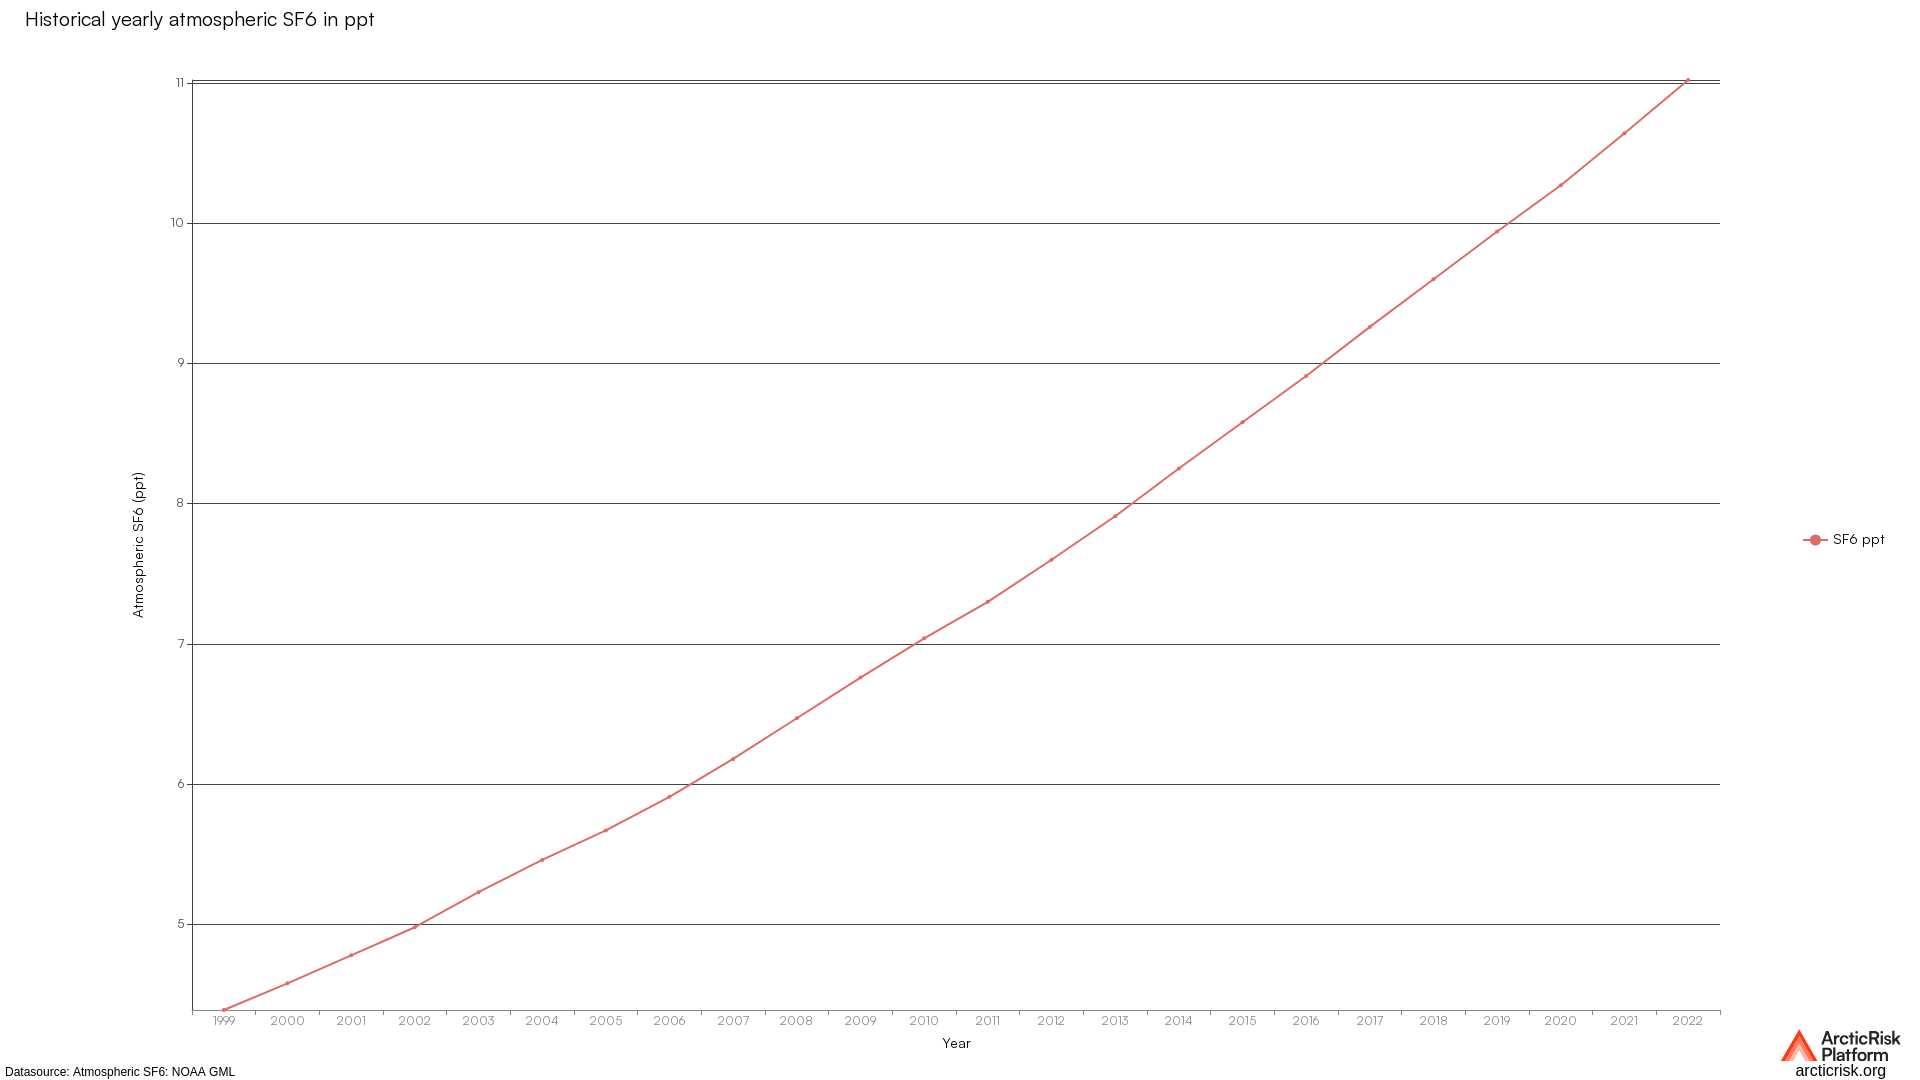
Monthly trends in Atmospheric Sulfur Hexaflouride. Derived from datasource available at NOAA Global Monitoring Laboratory.


Yearly trends in Atmospheric CO2 equivalent of greenhouse gases in ppm. Derived from datasource available at NOAA Global Monitoring Laborat…


Monthly trends in Atmospheric Carbon Dioxide. Derived from datasource available at NOAA Global Monitoring Laboratory.